A summary of some of the image processing/analysis on the Virgo images


Blog from Arizona observatory run [3/23/06-3/27/06]


To begin, we are just looking at certain regions: /VirgoMosaicFinal.fits


Individual Region images - clickable to "animate" through the steps of the following analysis
Core, Sub, LPC, FCJ, 1, 3, 4, 7, Durrell
(with original .fits files for each)


Formal writeups (LaTeX) of methods used satisfactorily:

Final masking choices (pdf file)


Analysis/Statistics

Most recent methods/analyses


Final methods


M87's Profile

Methods/Procedures used to examine it


M49's Profile

Residuals from the elliptical galaxy fits - Cool!


M84/M86 Pair

Are they friends? Here's what we know


Using dE instead of PNe

Same code, new catalog!


Summary of all methods used and procedures tried:


Initial BPM (Bad Pixel Mask) - just masking out bright stars (an initial step)
Example of final result (Core):


OBJMASKing - good results, "Black Magic"
Example of final result (Core):


Ring Median masking - smoothing out the galaxies (an initial step)
Example of final result (Core):


           Threshold brightness-masking of the Ring Median images - ok results, easy to reproduce
           Example of final result (Core):


           OBJMASKing the Ring Median images - decent results, tough to reproduce
           Example of final result (Core):


SExtractor - Another way to detect/catalog objects


STATISTICS  Now, with Monte-Carlo Error Bars!
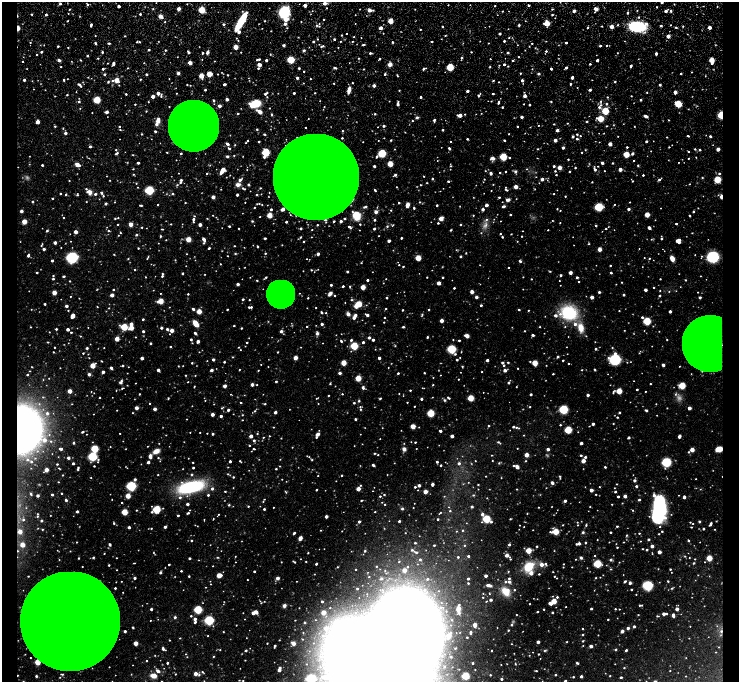
preparing
the data

Final masking techniques used*
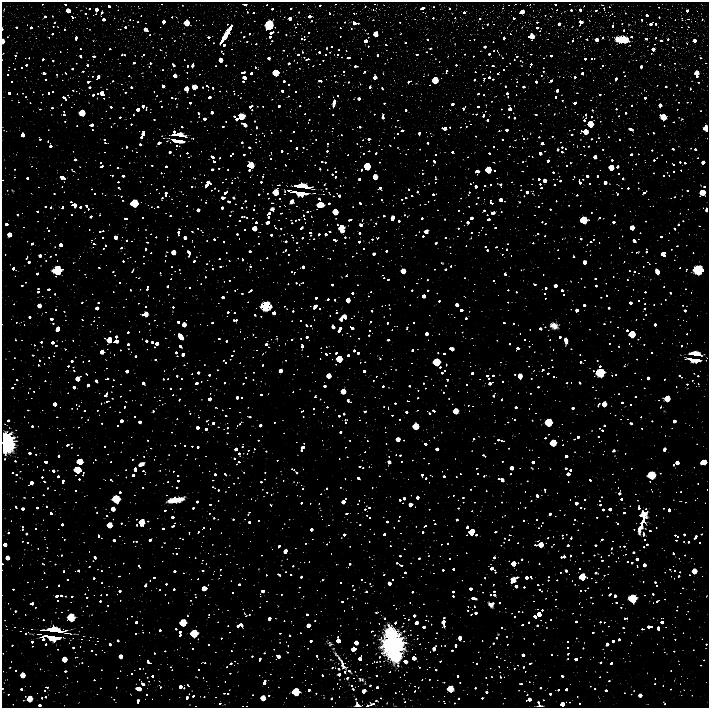
Theoretical data generation methods* &
sub-sampling to match observations
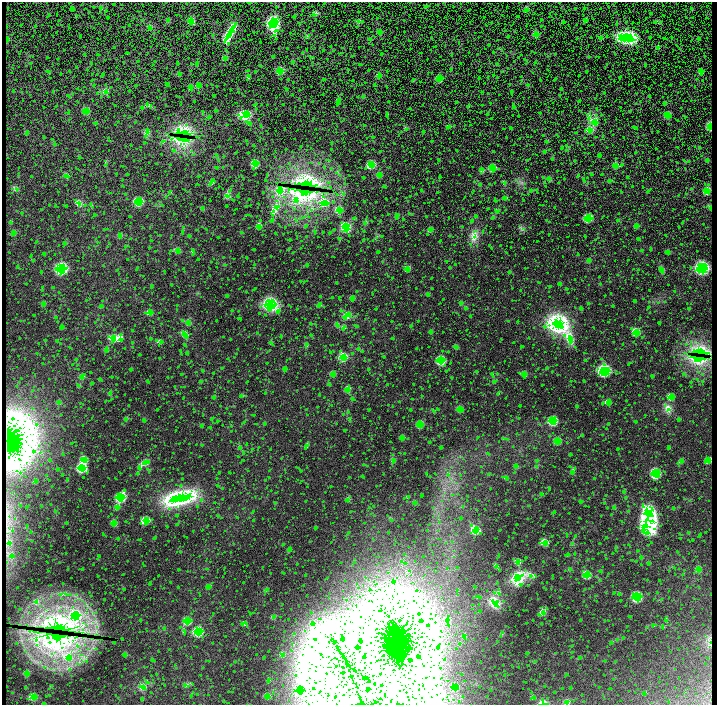
Methods to add contaminants to fake data*
Methods to smooth* and add contaminants to fake data
Changing smoothing size* O-MCStats on changes*
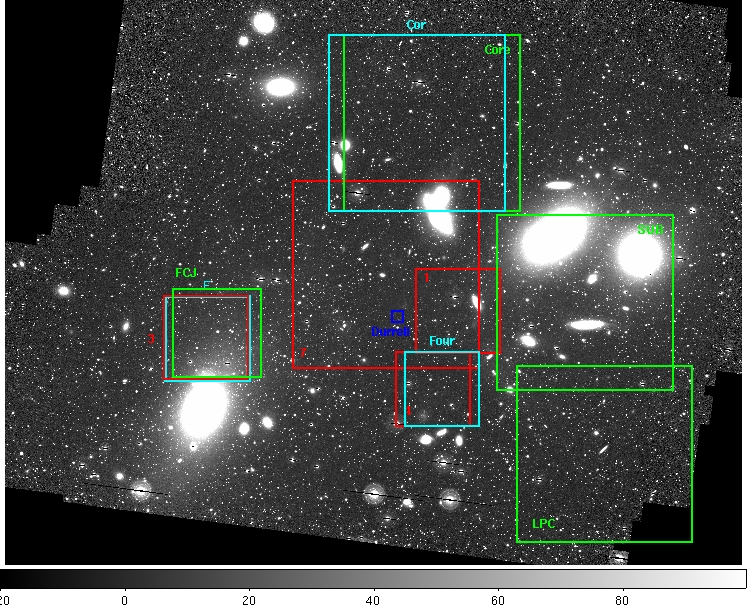
which data
is used

REAL DATA
FAKE DATA
FAKE DATA
(with contaminants)
FAKE (smoothed)DATA
(with contaminants)
box selection
method

   /
Centered
   /          \
\
Random
   /          \
   /
Centered
   /          \
\
Random
   /          \
  /
Centered
   /          \
\
Random
   /          \
  /
Centered
   /          \
\
   Random
      /       |      \
overlap?
overlapping
spaced
overlapping*
spaced
overlapping
spaced
overlapping
spaced
overlapping
spaced
overlapping
O-MC
spaced
overlapping spaced overlapping  0-MC*
trends
smooths*
spaced
Generally the results that are the most recent and believed are the Randomly selected overlapping boxes, most accurately the O-MC link, to the version where the box selections AND theoretical catalogs have both been Monte-Carlo-ed.

(Fairly) Serious Warning: Field 7 is not to be trusted. Due to an error on my part, MUCH of the analysis on it also included another set of data that should not have been (Feldmeier's Field 1). Consequently, the links above with stars* after them HAVE been corrected for this error. The essential bits have been fixed but many intermediate parts may still appear wrong. [note: a star can also just mean that that section of analysis was unaffected by this correction]

First attempt: Comparing field to field w/ Feldmeier/Aguerri [interesting to see, but not great]

How much are we oversampling with overlapping boxes? Here's some info*.

How many PNe need to be observed in order to see a real trend? Here's some info*.

Can we see the PNe in our images? Well.... Here's how*.

What if we smooth the images on different sizes to generate theoretical data? More info on the process/catalogs, More info on the statistics applied to this

Final analysis method


Preparing the data:
       In the case of the REAL data, little preparation was needed - so the link to our final masking technique is included. For the FAKE data sets, the links above them explain thoroughly how the data were generated.

Which data is used:
       This shows which data set has been used in this section of statistical analysis

Box selection method:
       Centered - For this method, boxes are placed with 4 separate methods: (1) centered on each PN, (2) centered on the midpoint between close-enough PNe pairs, (3) with 0 PNe in them, (4) randomly. Many more details are availible by clicking on the links in the table.
       Random - For this method, boxes are all random placed but with 3 separate stipulations: (1) they contain at least 1 PN, (2) they contain 0 PNe, (3) ignore PNe - just random. More details by clicking on the links in the table, of course.
       To see the real histograms generated on each run, check the older version that shows all histograms here.

Overlap:
       Overlapping - boxes in this method are drawn without paying any attention to previous boxes. This may lead to some oversampling, but it will always use plenty of data and make reasonable histograms/median values.
       Spaced - boxes in this method can only be placed so that they cover up no more than 50% of a previous box. This prevents over-sampling, but it restricts the amount of data in the histogram and increases the running time of the program (and doesn't even make much difference!).
       MC - the catalog AND the box selections have been Monte-Carlo-ed in this version.


OLD (and confusing) organisation of statistics:

            Doing Statistics on Results
                      Results on full image (just for fun)
                      Comparing to Feldmeier/Aguerri results
                      Counting PNe and averaging regions
                      Counting PNe and counting pixels
                      Counting PNe and counting pixels WITH u=25 mask and images of regions used
                      Counting PNe and counting pixels AND with boxes at least half a box-width apart for 2+ PNe sampling
                      Counting PNe and pixels, with boxes on the 2+ sampling on EVERY possible pair of PNe
                      Do Monte Carlo to get Error Bars for this method
                            Do this excluding overlapping boxes
                       Testing the amount of over/under sampling with our box selection methods
                      Select all random boxes but check that some DO have PNe, some do NOT have PNe, and some wholly random
                            Do this excluding overlapping boxes
                      Generate simulated theoretical PNe positional data from the surface brightnesses of our image
                         Sub-sample this data to get the same # of PNe as Feldmeier/Okamura
                         Include contaminants in this catalog, by degrees
                         Use alternative simulating data method (averaging over small regions rather than individual pixels)
                      Run first round of statistics on the simulated PNe data
                      Run random box statistics on the simulated PNe data with check that some DO or do NOT have PNe
                      Run centered boxes on simulated PNe data WITH contaminants by degrees
                      Run random boxes on simulated PNe data WITH contaminants by degrees
                      Run random boxes on alternative simulated PNe data
                      Run random boxes on MC of simulated catalog and MC of box placements
                     
Can we detect PNe in our images? well...


M87's Profile:

Generate theoretical data to test our analyses
Using NGC 4473 instead of M87, as it's cleaner
    using a bigger version of NGC4473
Comparing results for NGC 4473 to other work in the literature
DO IT ON M87! AND with the bigger image
    compare with others' results
    make more theoretical plots to test for substructure
Fit central regions and extrapolate fringes to subtract
    updated comparison to literature


M49's Profile:
Same as M87, fit inner regions, extrapolate outer regions, and subtract this from the observations!


M84 and M86: Close friends?
Part I: establishing masks/centers/etc
Part II: fitting/subtracting galaxy methods
    a) Using whole image but centering/fitting on one with the other masked
    b) Slicing image in half, fitting halves and re-combining fits
    c) Fitting central regions and extrapolating fits to subtract fringes

Compare our results to the literature


dE correlation?
Using dE catalog to try to correlate with light (as with the PNe)
    using full dE catalog from Trentham etal (2002)
    using only the dE/N from the catalog