dE samples/correlation - similar to PNe
Same code/method as with the PNe, but using dE instead.
Analysis on complete dE catalog
Analysis on only the dE/N sample
Combining regions around dE and dE/N
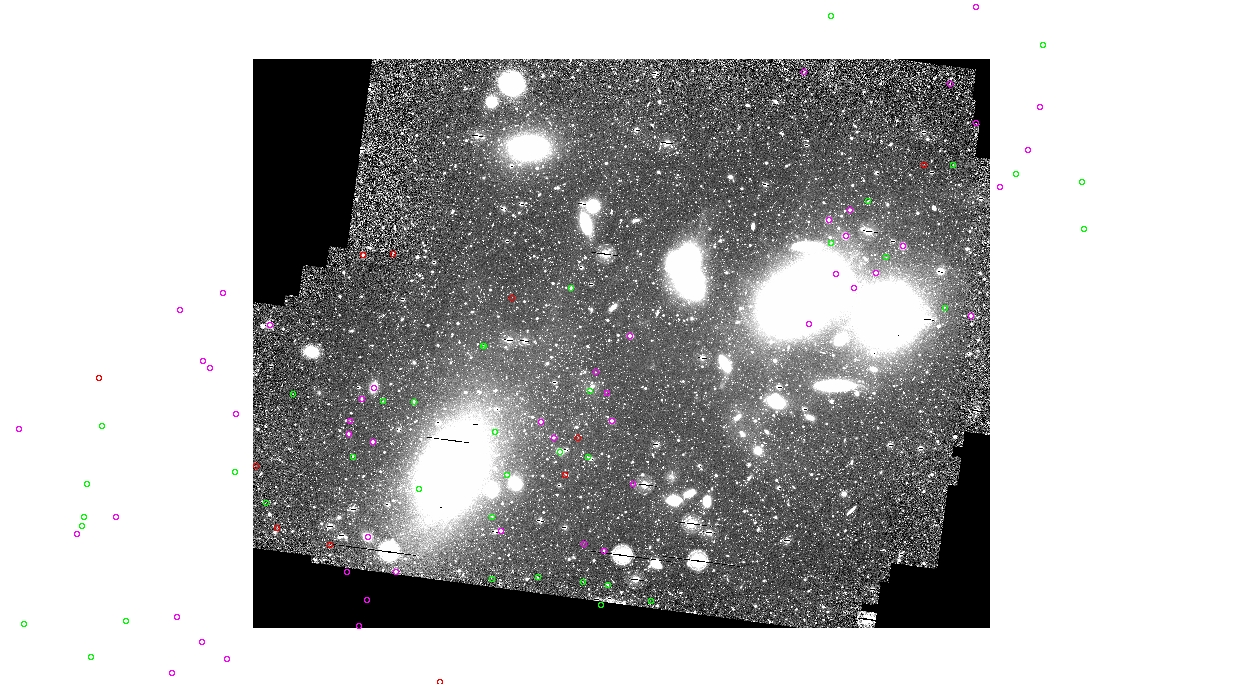
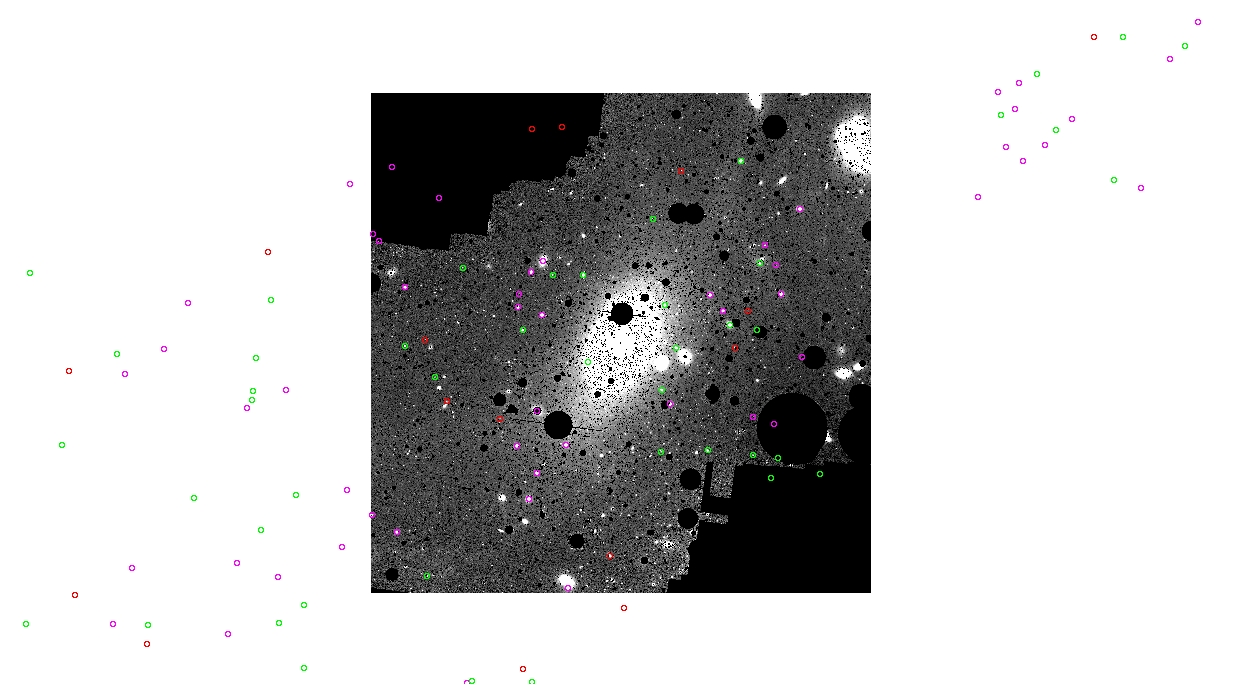
Here are two overall pictures of the distribution of dE from
"Luminosity function of the Virgo Cluster" (Trentham+, 2002).
dE -
green
dE/I -
blue
dE/N - magneta


For each field, and for whole images, here is a list of how many dE
there are:
Field
|
#
dE (all)
|
#
dE/N
|
#
dE/I
|
#
dE
|
3
|
2
|
|
|
|
4
|
0
|
|
|
|
7
|
6
|
|
|
|
Core
|
0
|
|
|
|
FCJ
|
1
|
|
|
|
LPC
|
0
|
|
|
|
Sub
|
2
|
|
|
|
M87
|
60
|
|
|
|
Virgo
|
68
|
|
|
|
So, for the most part the analysis is only run on 7, M87, and Virgo
fields (M87 being the image used in the isophote/ellipse/etc fits, and
Virgo being VirgoMosaicFinal.fits)
back to main Virgo page

