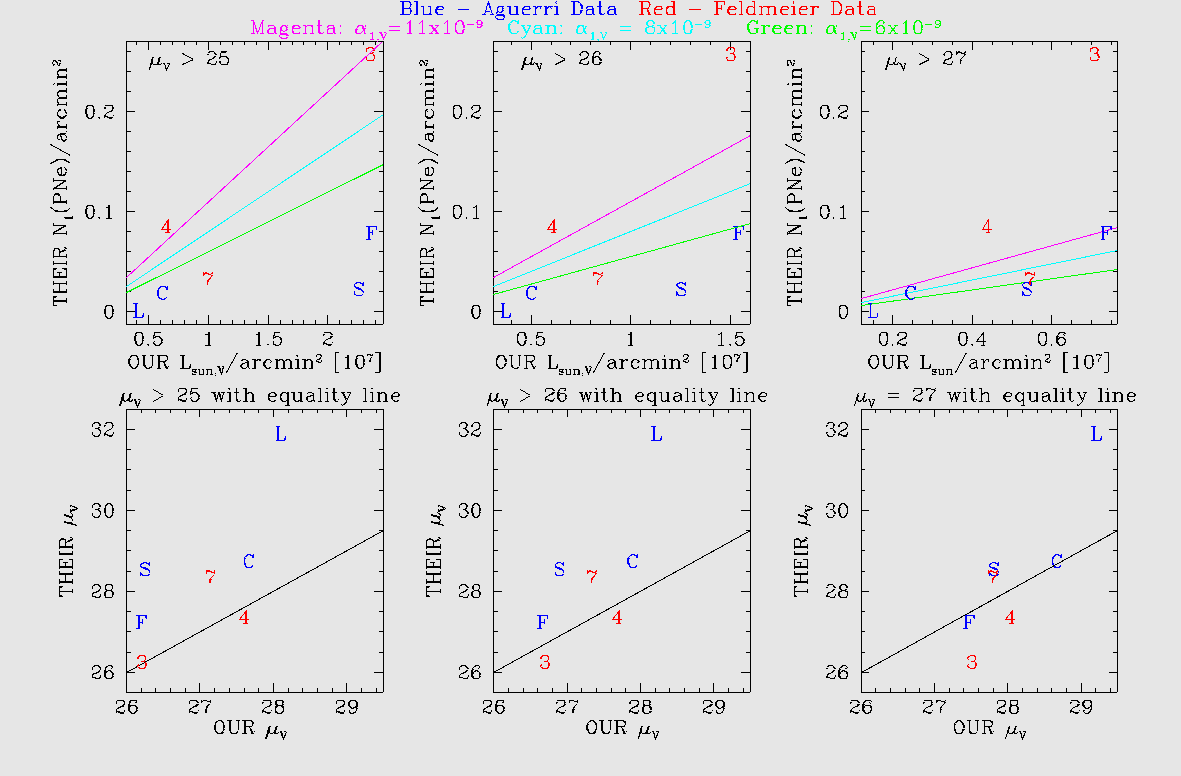
Comparing our results with Feldmeier and Aguerri

This is the final plot comparing our data with Feldmeier and Aguerri data:
[explanation/calibration/details are below]                                                                                                                                        [click here for the postscript version]


First comparison:
Feldmeier and Aguerri:  Density of PN (Planetary Nebula(e)) in Number / arcmin^2
      with
Our data: Luminosity Density in Solar Luminosities_V / arcmin^2

Using the linear relationship (given below) in PNe between number (n_PN) and total bolometric luminosity (L_T), by counting PNe, estimates have been generated for luminosities.
n_PN = alpha() * L(bol)_T
and the parameter alpha depends on physical bits with the PNe. When referenced, alpha(B)_1.0 will mean that it is concerned with B-band and M*-M = 1.0.

This is great for the total Luminosity and total Number, but those are basically impossible to measure when we have limitations on visible magnitudes and colors. Instead, Feldmeier and Aguerri use (different, alas) ways around it. Both use different values of alpha, reflecting the sample size, around the M* point, and the color.
Feldmeier uses alpha(V)_2.5 and Aguerri uses alpha(B)_1.0. Aguerri also cites a conversion between these as alpha()_1.0 / alpha()_2.5 ~ 0.24, on which we soon rely.

Aguerri reports the following numbers of PNe within M*+1 (alpha(B)_1.0 = varies)
Field
N_ICPNe
Area (arcmin^2)
ICPNe / arcmin^2
Core
17
943
0.018
FCJ
15
266
0.056
LPC
1
744
0.001
SUB
14
706
0.020
[from Aguerri (2005)]

These will be the actual values we compare with soon, as we will adopt the alpha_1.0 values.

Feldmeier gives these values within M*+2.5 (alpha(V)_2.5 = 23 x 10^-9)
Field
N_27.0
(Extrapolated)
Estimated Number
of Contaminants
N_ICPNe
col_2 - col_3
Area
(arcmin^2)
ICPNe /
arcmin^2
3(h)
21
4.6
16
241
0.06639
4
21
3.0
18
158
0.11392
7
44
21
23
1098
0.02095
[columns 1, 2, 3, 5 from Feldmeier(2003)]

Now we need to convert Feldmeier's values based on alpha(V)_2.5 into their equivalents based on alpha(B)_1.0.

We know:
N()_1.0 = alpha()_1.0 * L()
N()_2.5 = alpha()_2.5 * L()
alpha()_1.0 = 0.24 * alpha()_2.5

So we plug the equation for alpha()_1.0 into the equation for N()_1.0 and get:

N(V)_1.0 = 0.24 * alpha(V)_2.5

Since Feldmeier gives his value of alpha(V)_2.5 = 23 x 10^-9 for L_bol, we can use his given bolometric luminosities and compute the N(V)_1.0 values:
Field
Luminosity(bol)
(10^9 L_Sun)
N_1.0/arcmin^2
3(h)
9.0
0.20614
4
2.4
0.08386
7
6.5
0.03268
[columns 1 & 2 from Feldmeier(2004)]

Now we have all of Feldmeier's and Aguerri's data in the same format! It's time to correct for a slight problem in their method:
Since they cannot observe PNe that are in front of the galaxies their samples only reflect the amount of ICL not in the same line-of-sight as the galaxies. We correct by multiplying their results by 1 + our fractional (rough) estimate of the size of the bright galaxies (obtained by examining their sizes in our u>26 masks). The results:
Field
fractional estimate
of galaxy coverage
Their results
N_1(PNe)/arcmin^2
Corrected results
N_1(PNe)/arcmin^2
[used for plots]
Core
0.05
0.01803
0.01893
FCJ
0.15 0.01983
0.0228
LPC
0.00 0.00134
0.00134
SUB
0.40 0.05639
0.07895
3(h)
0.25
0.20614
0.2577
4
0.02
0.08386
0.08554
7
0.05
0.03268
0.03268


Next we get our own data all worked out:

We know (from iraf) the mean value of the unmasked pixels in each field. We need to find the luminosity density in units of L_Sun / arcmin^2 in order to compare these.

For this data, 1 count is 29.2 mag/arcsec^2 or 0.0673 L_Sun / pc^2. Since Virgo is at 16 Mpc, 1 arcmin^2 corresponds to 2.17 x 10^7 pc^2. Thus 1 count = 1.5 x 10^6 L_sun / arcmin^2.
This allows us to convert counts into real units as shown in the following table:
Field
Average Counts
Luminosity Density
[used for plots]

Median Counts
u>25
u>26
u>27
u>25
u>26
u>27

u>25
u>26
u>27
Core
4.108
3.342
1.629
0.6162
0.5013
0.2444

3.276
3.096
2.068
FCJ
15.78
10.28
4.907
2.367
1.542
0.5368

13.190
10.125
5.402
LPC
2.759
2.479
0.9944
0.4139
0.3719
0.1492

2.552
2.477
1.523
SUB
15.06
8.359
3.579
2.259
1.254
0.5368

11.442
8.312
4.194
3(h)
15.71
10.02
4.716
2.356
1.503
0.7074

12.975
9.934
5.205
4
4.340
4.044
2.913
0.651
0.6066
0.4369

3.832
3.769
3.113
7
6.647
5.564
3.637
0.997
0.8346
0.5455

5.417
5.191
3.930
the median values for each field are also included to give an indication of the distributions

Big picture:
We are expecting a correlation between the ICPNe Density (calibrated farther above) and Luminosity Density (calibrated just above). When we plot these, we get the graphs at the top of this page.


Second Comparison
Feldmeier and Aguerri surface brightness (V-band)
           with
Our data's surface brightness (V-band)

Feldmeier gives surface brightnesses in V-band and no conversions are needed:
Field
mu_V
3(h)
26.5
4
27.4
7
28.4
[Feldmeier (2003)]

Aguerri gives many values for surface brightness (in B-Band), depending on the value of alpha(B)_1.0 used. We select the values he says he got from Durrell et al. (2002) from IC RGB stars from HST, which is alpha(B)_1.0 = 13.30
These values are converted to V-Band with the B-V conversion of 1.0
Field
mu_B
mu_V
Core
29.8
28.8
FCJ
28.6
27.6
LPC
32.9
31.9
SUB
29.7
28.7
[columns 1 & 2 from Aguerri (2005)]

As before, we apply the correction factors to their data to account for the bright galaxies through which they cannot see PNe:
Field
fractional estimate
of galaxy coverage
Their results
mu_V
Corrected results
mu_V
[used for plots]
Core
0.05
28.8
28.75
FCJ
0.15 27.6
27.23
LPC
0.00 31.9
31.90
SUB
0.40 28.7
28.55
3(h)
0.25
26.5
26.26
4
0.02
27.4
27.38
7
0.05
28.4
28.35


All that remains is to get our data into these units.
We have computed medians on the masked images from NewSpikeMode (and confirmed them with iraf) and these require a simple conversion to get to surface brigthness.
mu = -2.5 * log(median value) + 29.2
However, in order to best compare our data to the other data, an average should be taken. The results Feldmeier and Aguerri are basically averages of surface brightness over the fields, so to compare, we need the average value, too.
Field
Median value
Surface Brightness (median)

Mean value
Surface Brightness (mean)
[used for plots]
u>25
u>26
u>27
u>25
u>26
u>27

u>25
u>25.5
u>26
u>26.5
u>27
u>25
u>25.5 u>26
u>26.5 u>27
Core
3.276
3.096
2.068
27.91
27.97
28.41

4.108
3.759
3.342
2.671
1.629
27.67
27.76
27.89
28.13
28.67
FCJ
13.190
10.125
5.402
26.40
26.69
27.37

15.78
13.25
10.28
7.527
4.907
26.20
26.39
26.67
27.01
27.47
LPC
2.552
2.477
1.523
28.18
28.22
28.74

2.759
2.671
2.479
2.011
0.9944
28.10
28.13
28.21
28.44
29.21
SUB
11.442
8.312
4.194
26.55
26.90
27.64

15.06
11.05
8.359
5.991
3.579
26.26
26.59
26.89
27.26
27.82
3(h)
12.975
9.934
5.205
26.42
26.71
27.41

15.71
13.03
10.02
7.334
4.716
26.21
26.41
26.70
27.04
27.52
4
3.832
3.769
3.113
27.74
27.76
27.97

4.340
4.249
4.044
3.695
2.913
27.61
27.63
27.68
27.78
28.04
/7
5.417
5.191
3.930
27.37
27.41
27.71

6.647
6.103
5.564
4.872
3.637
27.14
27.24
27.32
27.48
27.8


The resulting values for Feldmeier and Augerri's mu_V are plotted on the above graph with our values.


But wait, let's try to compare the distribution of PNe and Luminosity to see if there's any correlation


back to Statistics page

back to main Virgo page