Monte Carlo-ing (some of) the Uncertainty in our
methods (PNe7)
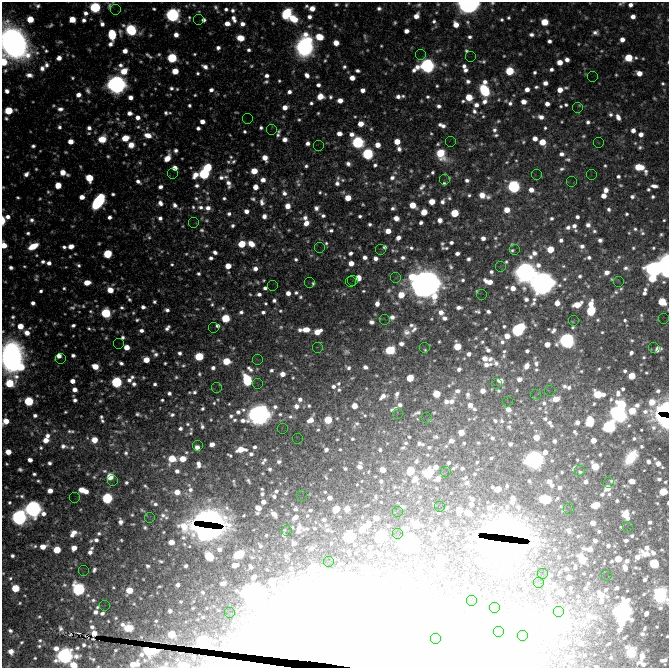
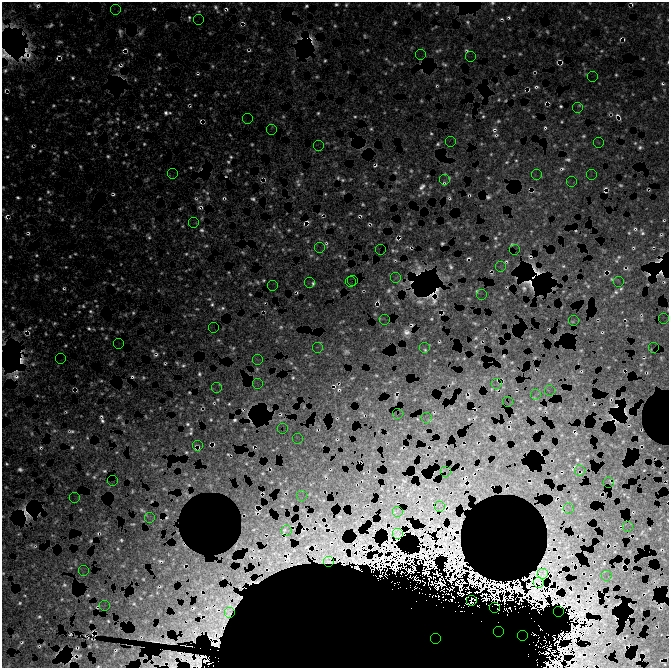
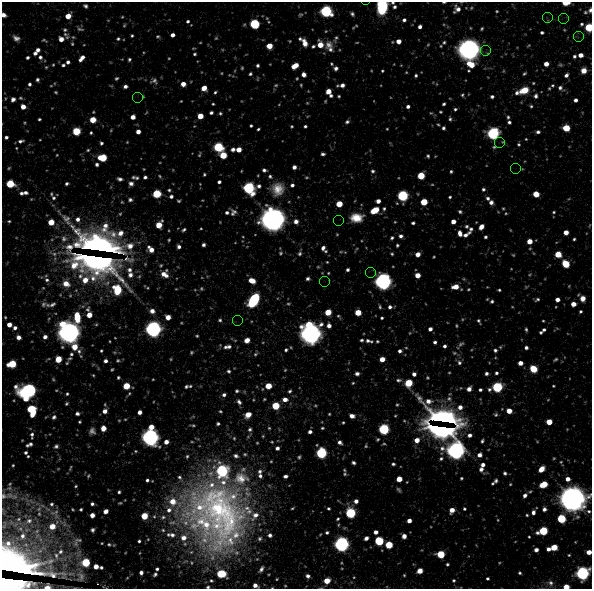
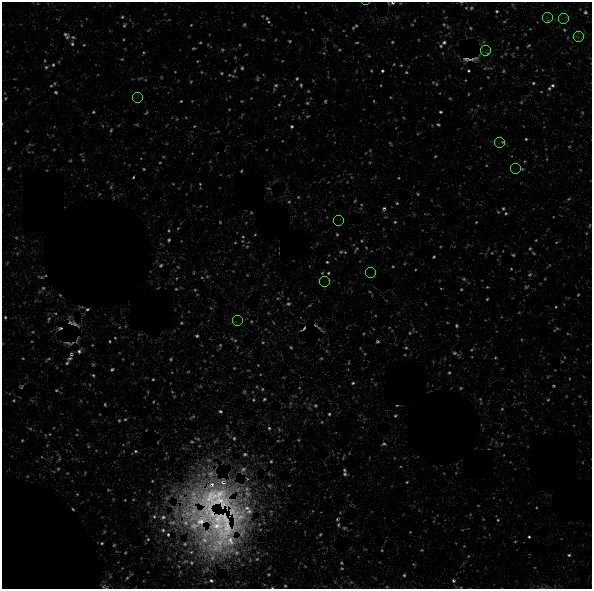
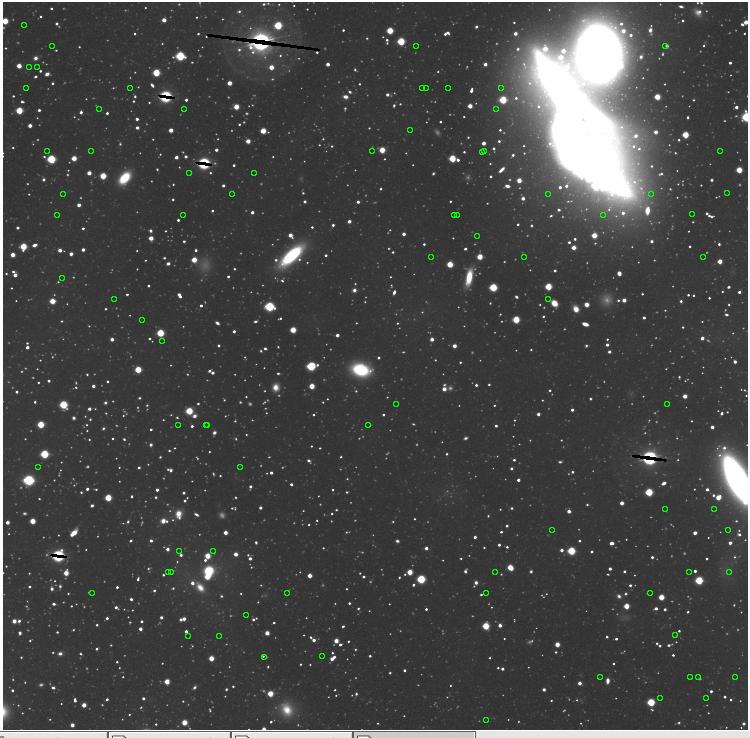
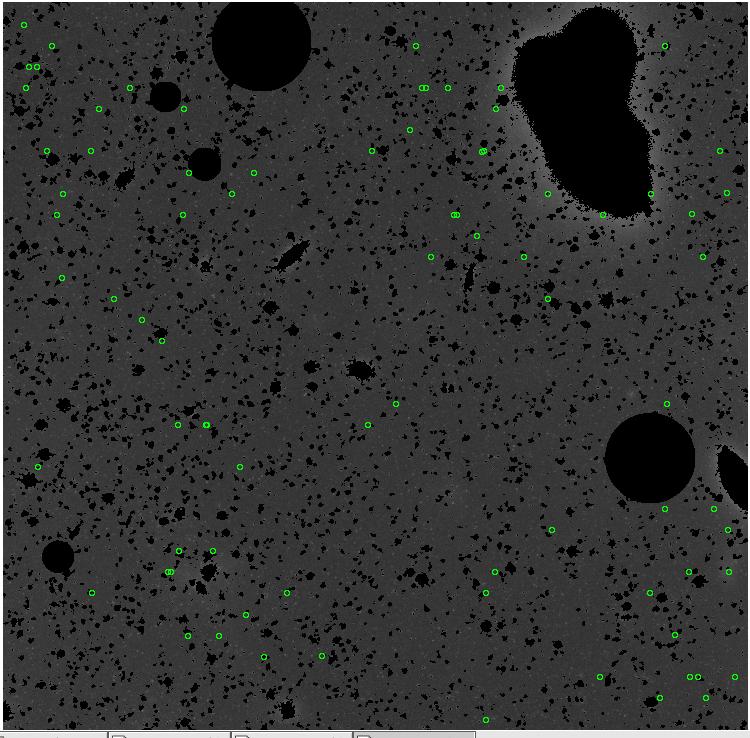
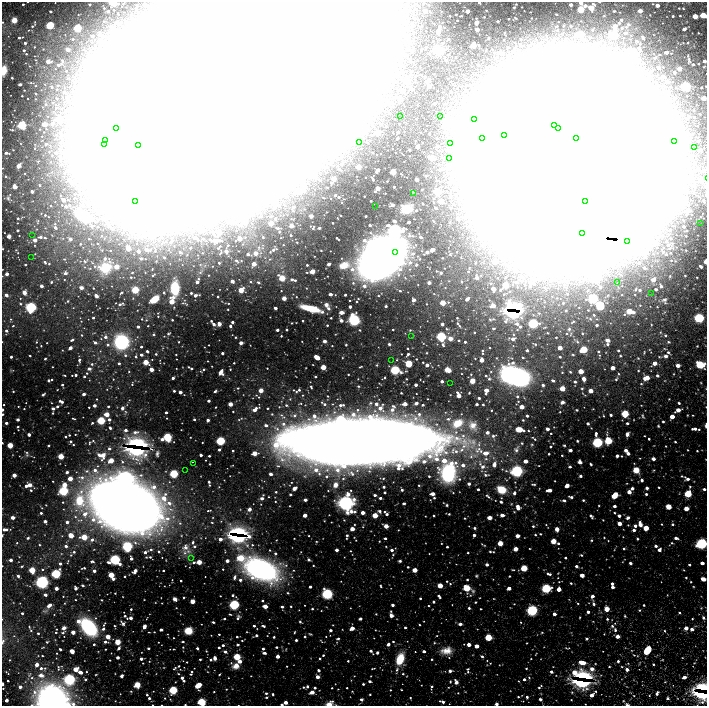
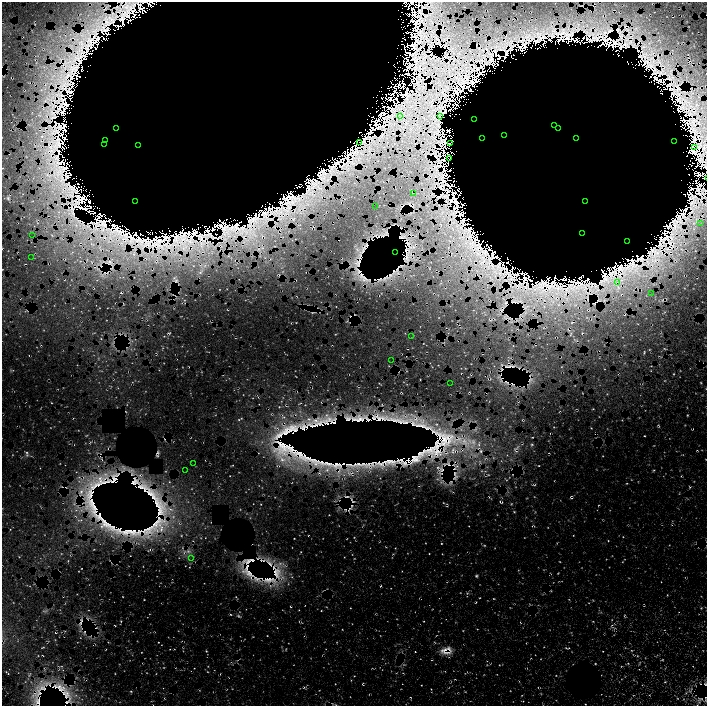
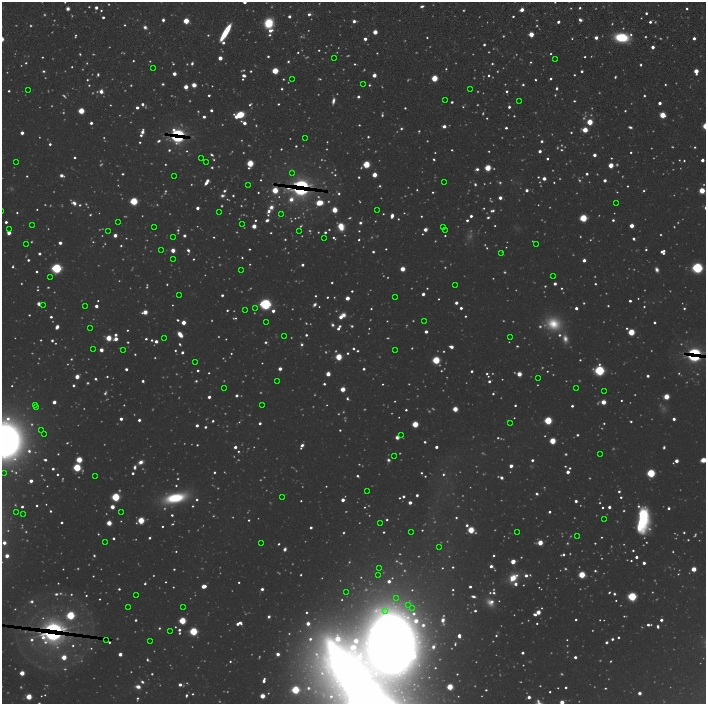
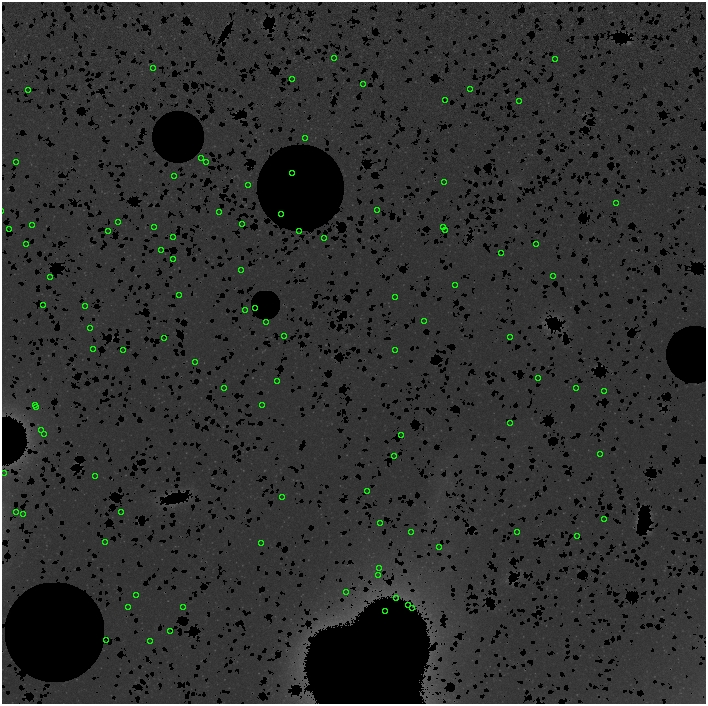
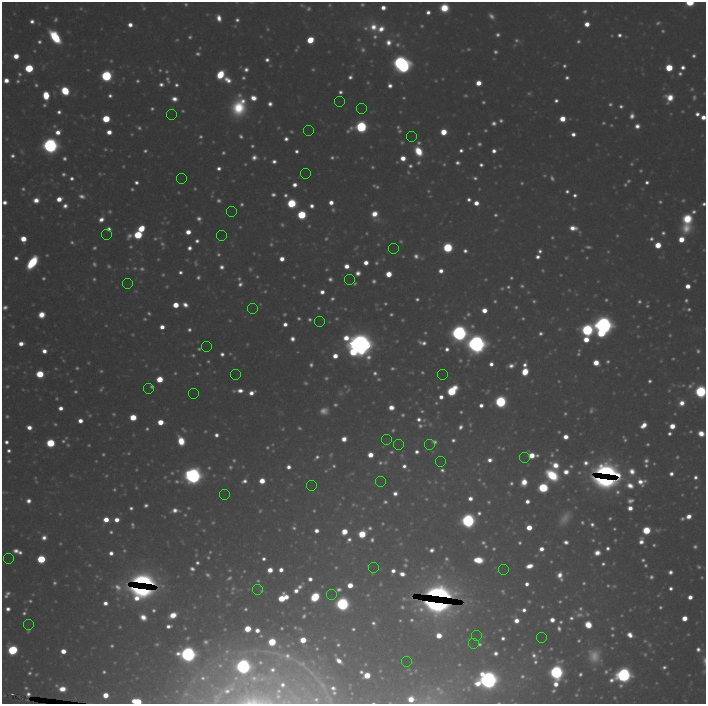
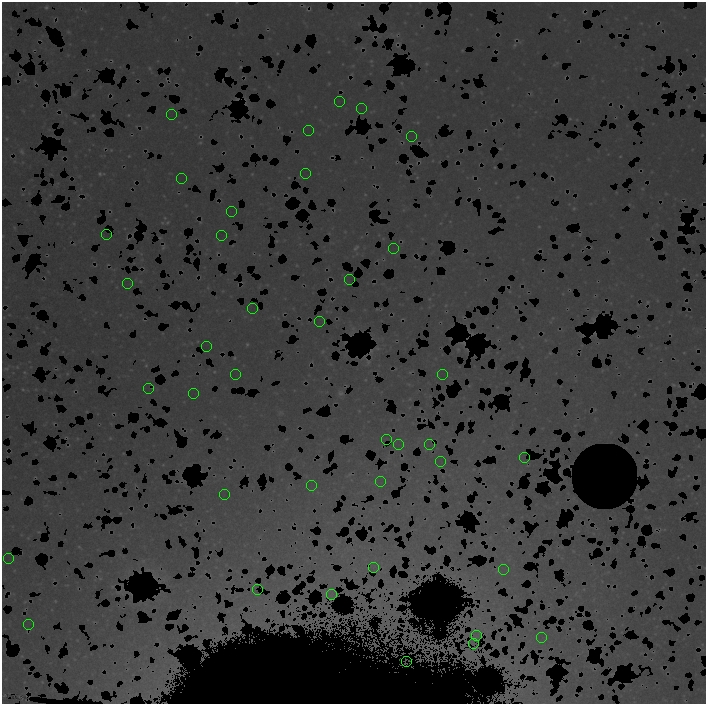
What follows is an image of the regions, masked or unmasked, with PNe
as green circles.
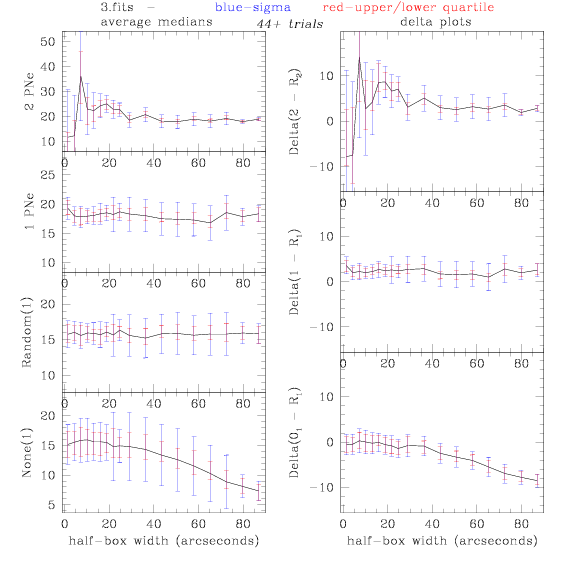
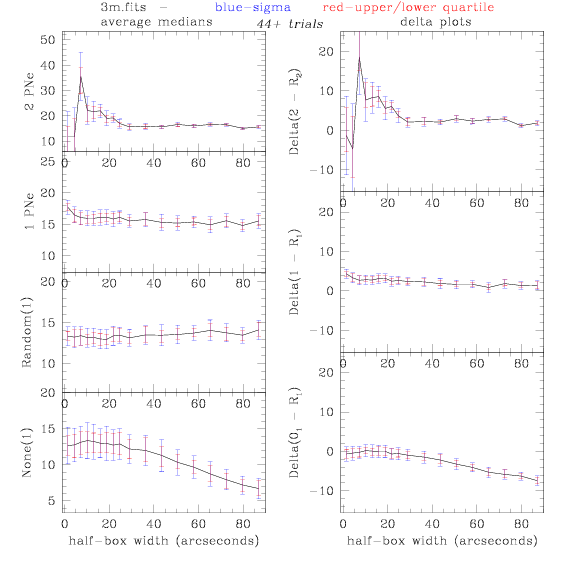
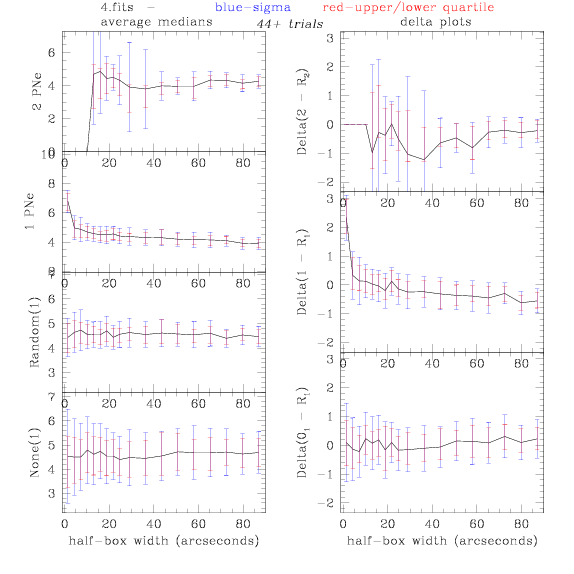
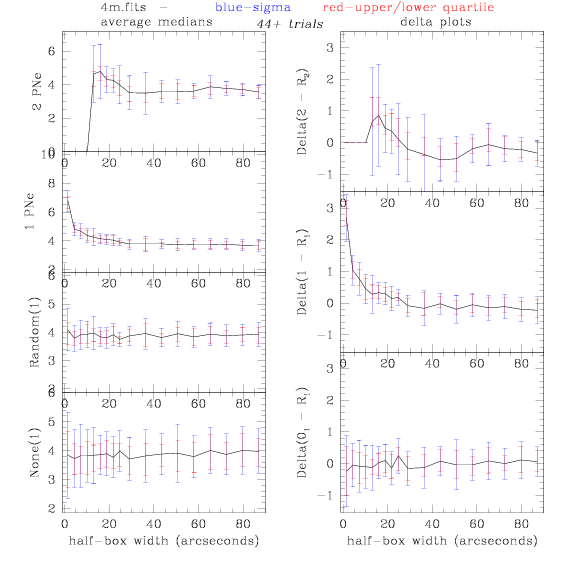
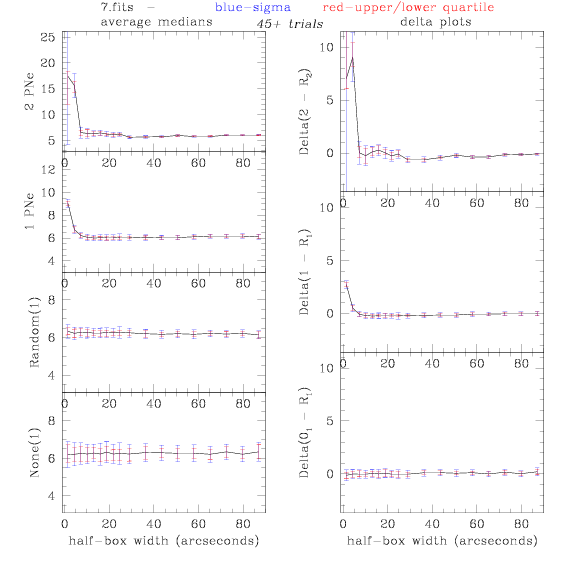
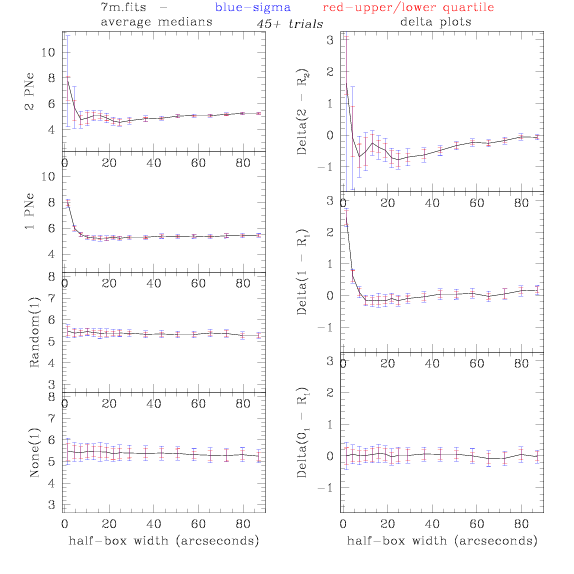
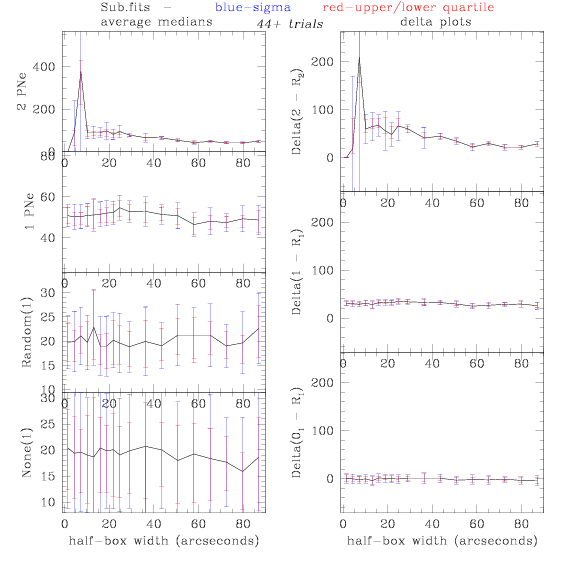
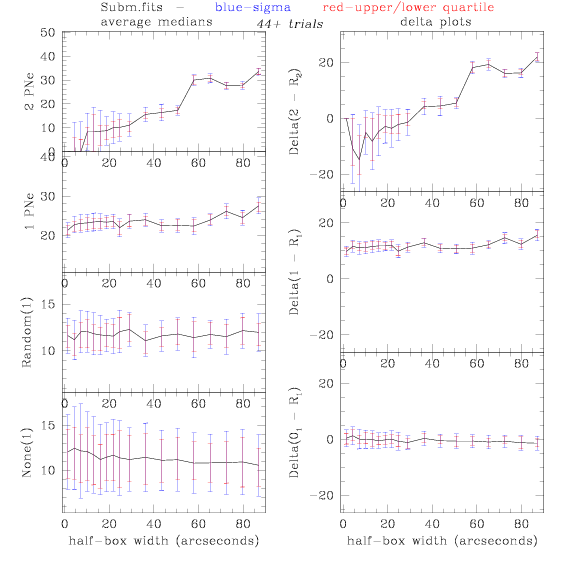
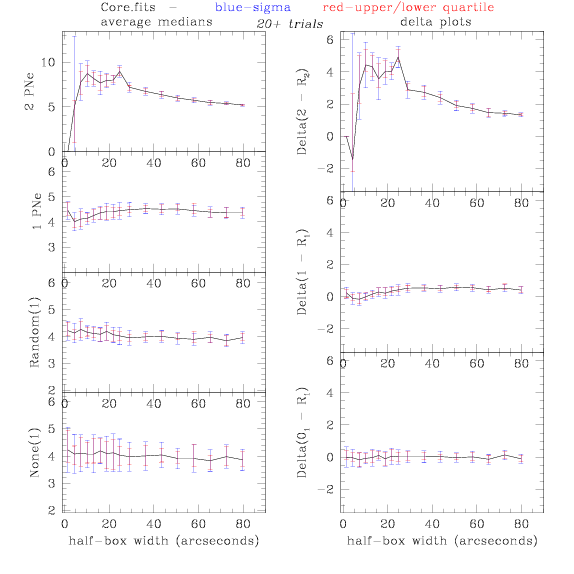
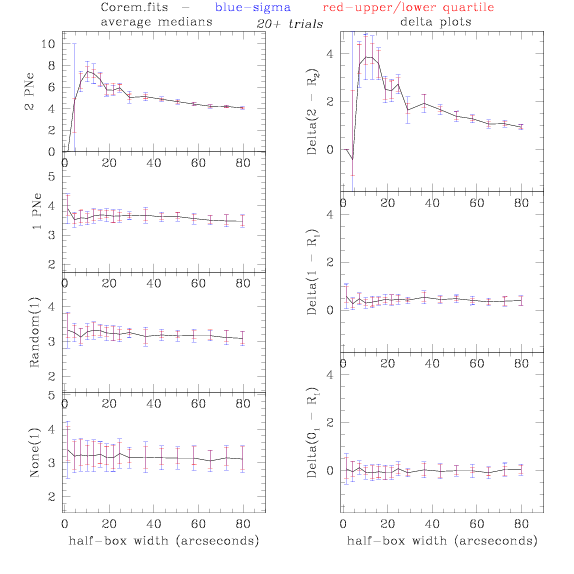
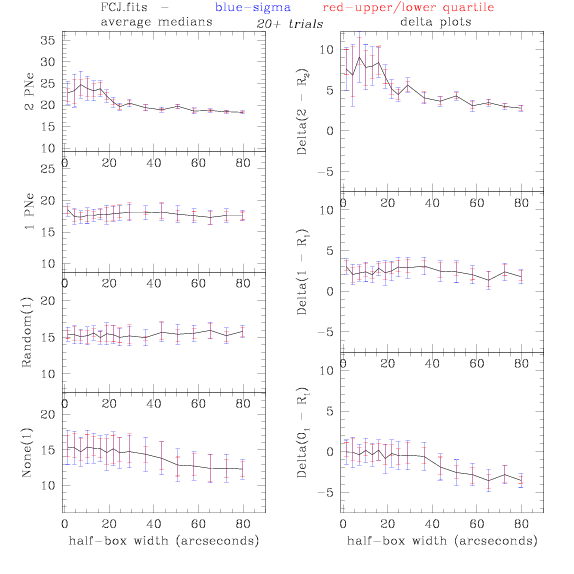
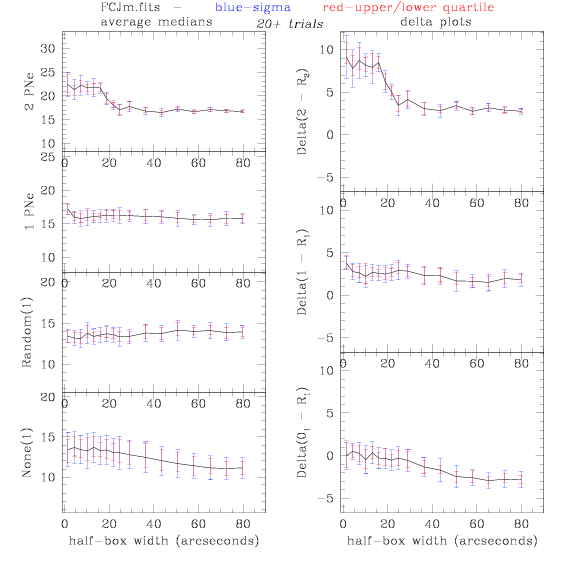
The next graphs are results from doing multiple iterations of the same
program, and storing results. The error bars are found with a couple
methods:
Random Error Bars: the number of (totally) random boxes is set equal to
the number of PNe found in the region (random(1)) and then to the
number of 2 PNe regions (random(2))
Off PNe Error Bars: the number of PNe-free boxes is set equal to the
number of PNe found in the region (off(1)) and then to the number of 2
PNe regions (off(2))
The error bars on graphs of 1 and 2 PNe found come from the
appropriately sampled Random Error Bars.
OVERLAP IS ALLOWED!! 1 PNe/box means EVERY PNe gets a box around it, 2
PNe means EVERY pair that can fit gets a box, 0 PNe means random boxes
might overlap, random boxes might overlap too!
Error bars on delta graphs are simple Sigma/Quartile calculations
across all Delta values from each trial.
Things to consider:
The version with 1 box on each PN
should probably be done differently - rather than CENTERING on each
PNe, should just make a box with each PN in it, but with the PN at a
random location within the box, not fixed at the center - see next page for this realisation
We do not (in this version)
Monte Carlo the PN catalog, that is, we (should?/could?) subsample that
catalog randomly to get better error estimates
(skip to results)
Detailed listing of code:
PNe.sm - PNe
- initial program that starts others
reads in data, version #, iteration
#, and sets operating parameters
start running
sub-programs/macros (PNew, PNe1, PNe2, PNe31, PNe32, PNe41, PNe42)
PNew - prep data - read fits header, convert
into decimal degrees, for
storage
PNe1
- box on each PNe section
loop over every PNe, check if it's inside this
field, check (if applicable) if any other boxes are too close to this
one
keep track of how many PNe are found, but DO NOT
add their pixels up - this is done only once and stored in a 0.0.* file
write out locations of boxes (fairly meaningless at
this point)
PNe2
- boxes on pairs
calculate distance between EVERY possible PN pair,
find distances that would fit inside a box
again, do not count pixels as we're only concerned
w/ how many are found for now
write out (worthless) locations of boxes
PNe31 - random boxes - the
same number as there are 1 PNe boxes
select as many random boxes as there were 1 PNe
boxes found
check (if applicable) for overlap
write out locations of boxes
PNe32 - random boxes - same
number as 2 PNe boxes
select as many random boxes as there were 2 PNe
boxes found
check (if applicable) for overlap
write out locations of boxes
PNe41 - 0 PNe boxes - same
number as 1 PNe boxes
select as many boxes as there were 1 PNe boxes that
contain 0 PNe
check (if applicable) for overlap
write out locations of boxes
PNe42 - 0 PNe boxes
- same number as 2 PNe boxes
select as many boxes as there were 2 PNe boxes that
contain 0 PNe
check (if applicable) for overlap
write out locations of boxes
PNeg
- graphing and more
generate histograms for each PNe1-PNe42, find
medians
write median data to file
graph histograms and save to .ps
files
THESE ERROR BARS ARE NOT TOTAL ERROR -
they reflect a "minimum" or "partial" error in the data as they only
deal with errors associated with our box selections around the images
and NOT with PNe selections (or anything else)
Quick
links to fields:
3/3m
4/4m
7/7m
Sub/Subm
Core/Corem
LPC/LPCm
FCJ/FCJm
3.fits
3m.fits (with
3RSMCu25.pl overlay)
4.fits
4m.fits (with
4RSMCu25.pl overlay)
7.fits
7m.fits (with
7RSMCu25.pl overlay)
Sub.fits
Subm.fits
(with SubRSMCu25.pl overlay)
Core.fits
Corem.fits
(with CoreRSMCu25.pl overlay)
LPC.fits
LPCm.fits (with
LPCRSMCu25.pl overlay)


FCJ.fits
FCJm.fits (with
FCJRSMCu25.pl overlay)
next?
back to previous stats page
back to main Virgo page


