PNe
statistics, part 2
We are still attempting the same general idea as before, but now
looking at light distributions around PNe vs. not around them. As
before, we are breaking the image up into small square regions and
addressing the data in each of them.
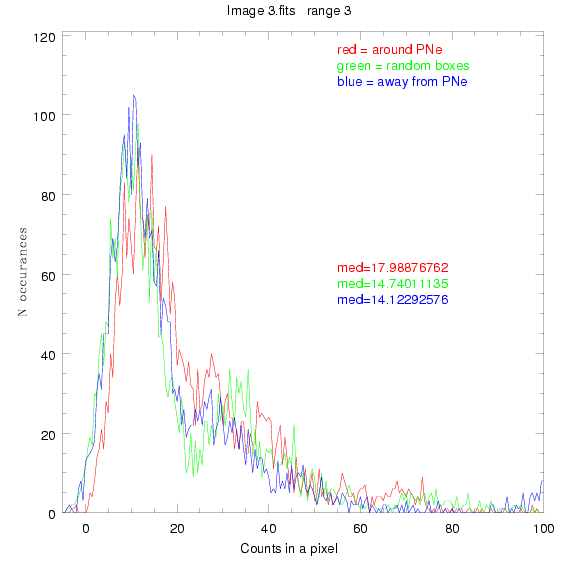
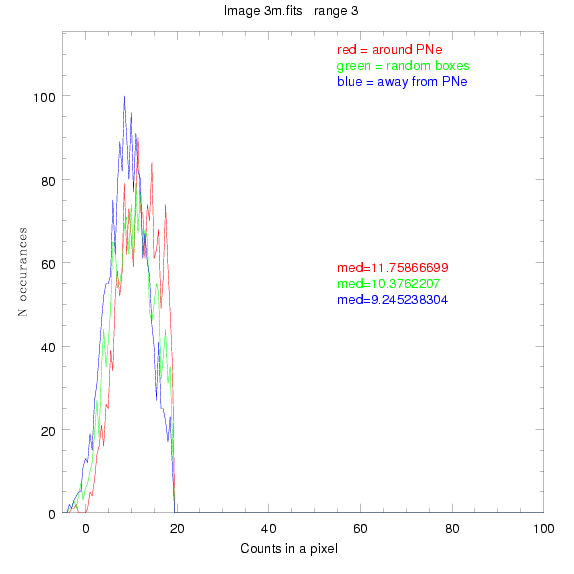
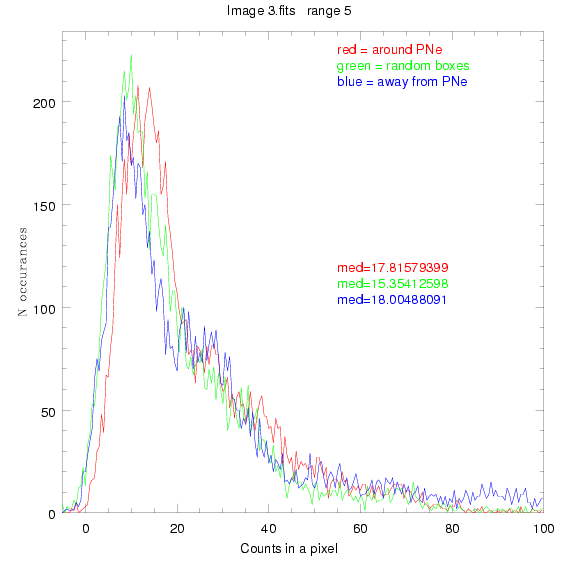
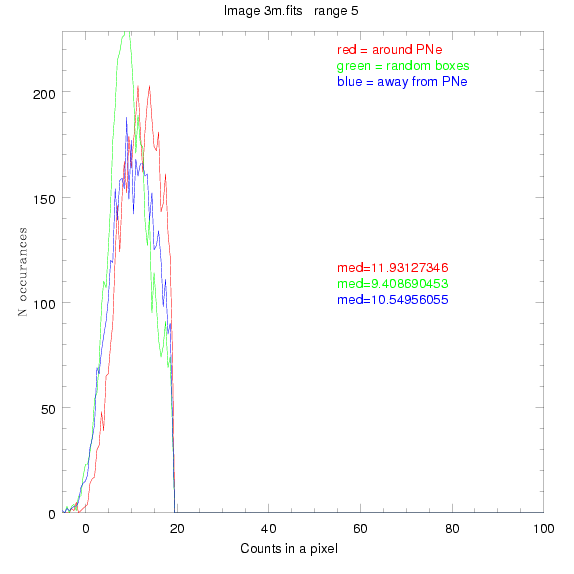
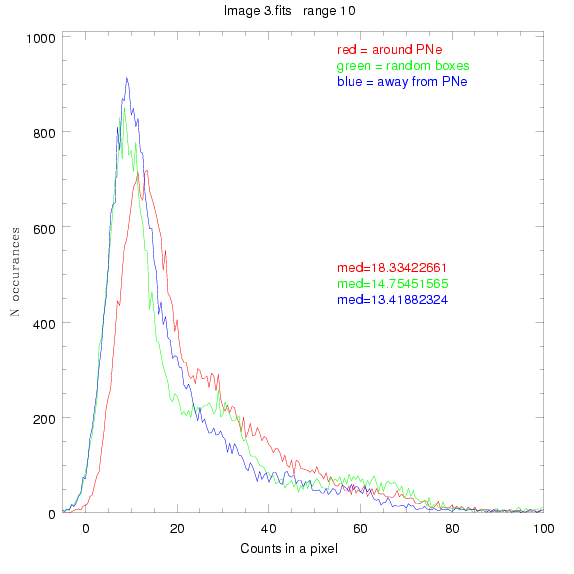
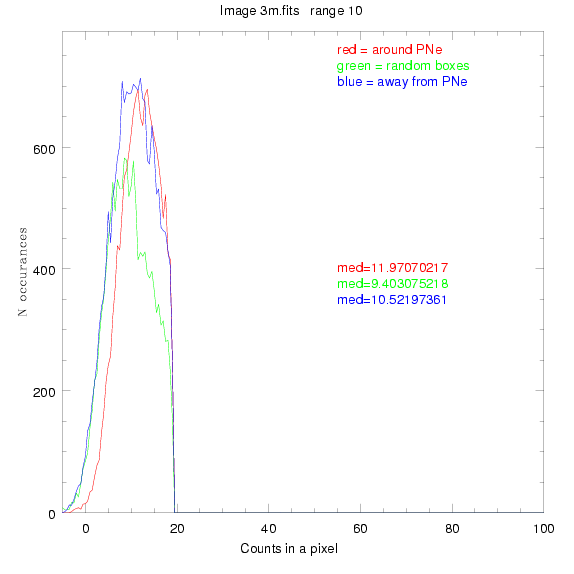
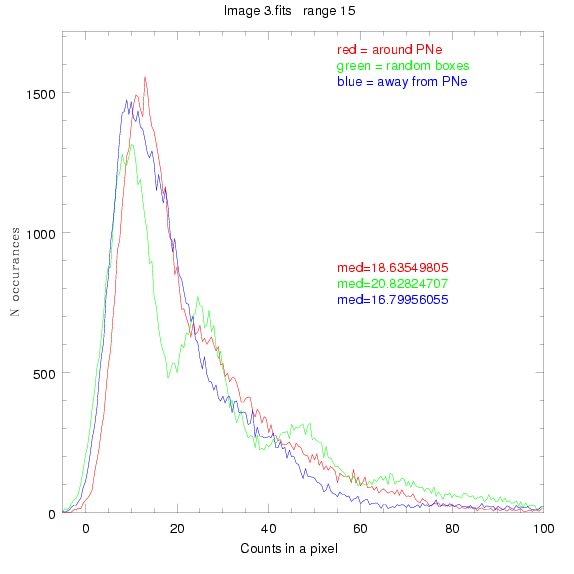
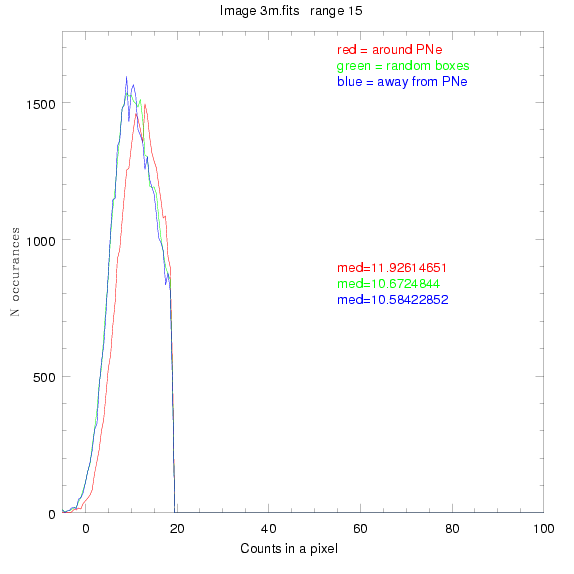
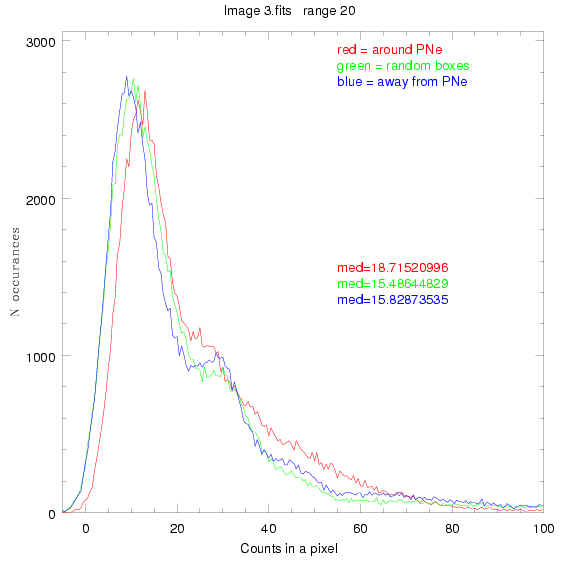
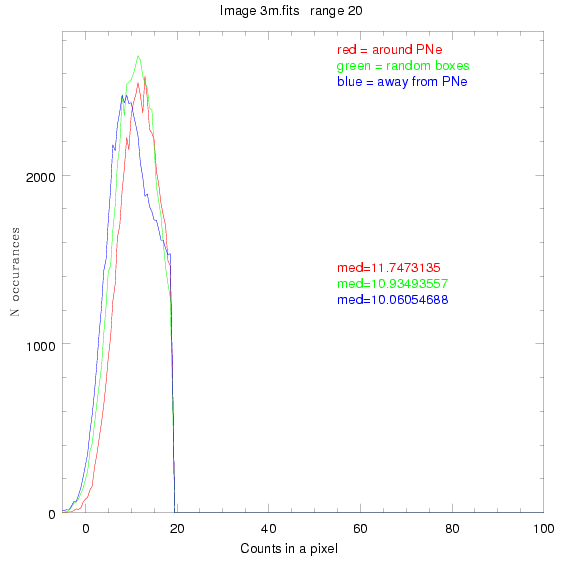
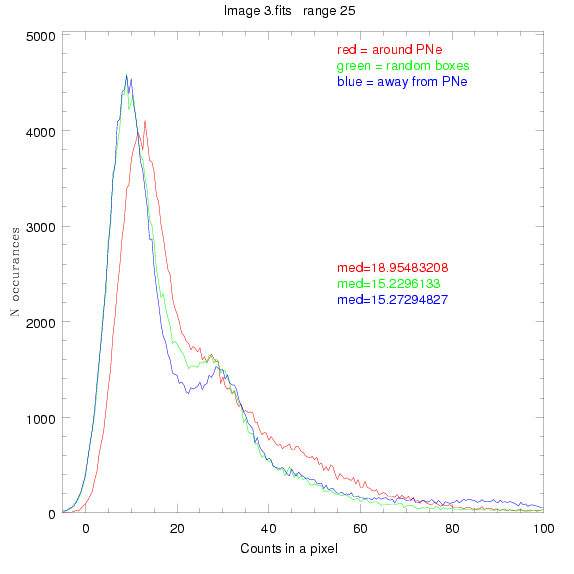
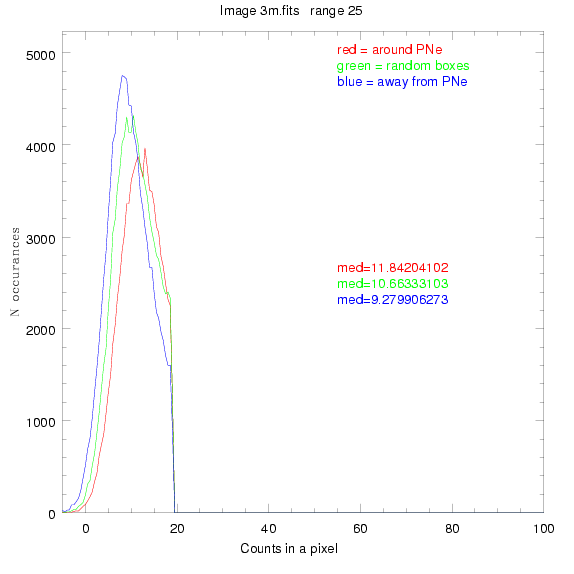
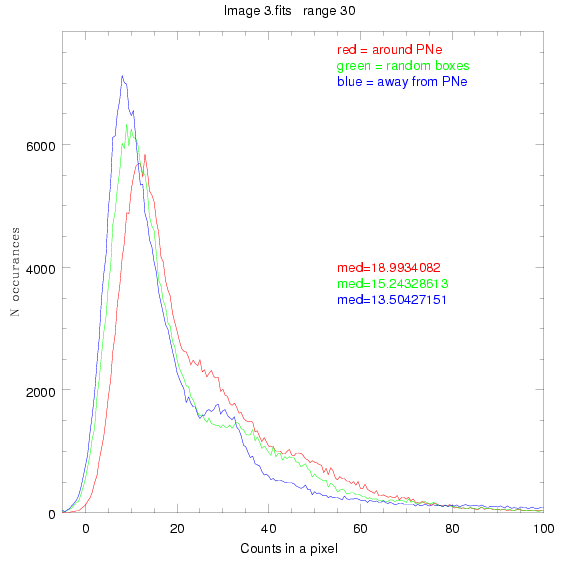
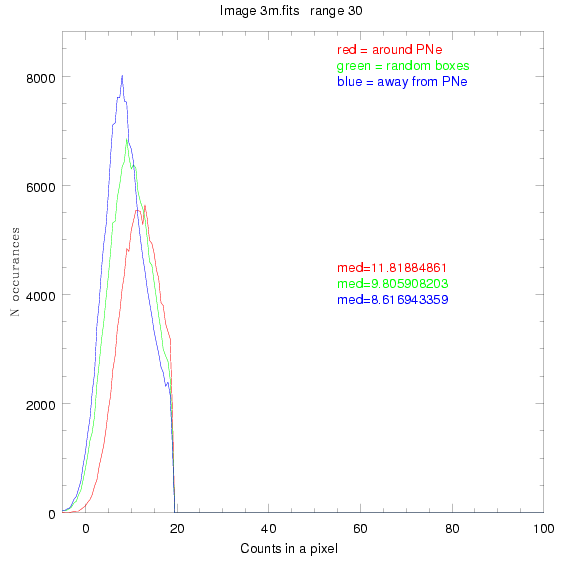
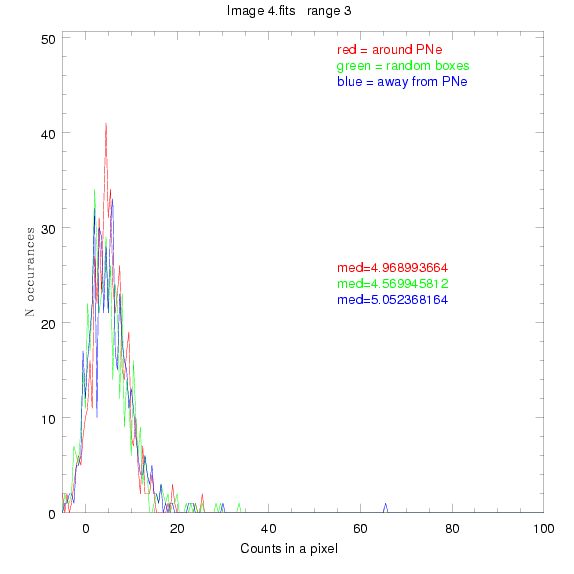
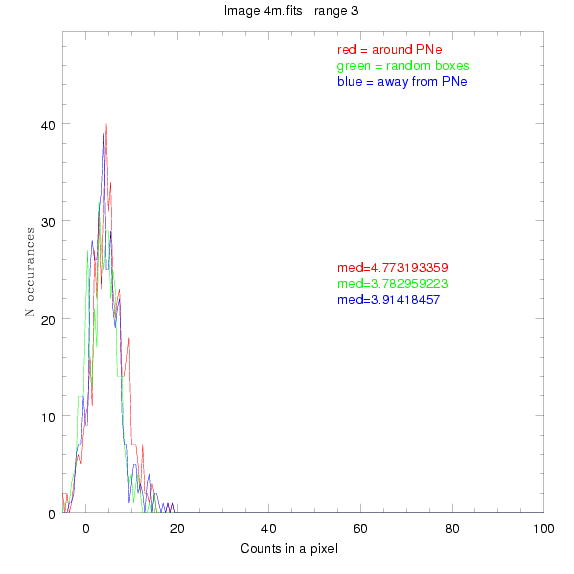
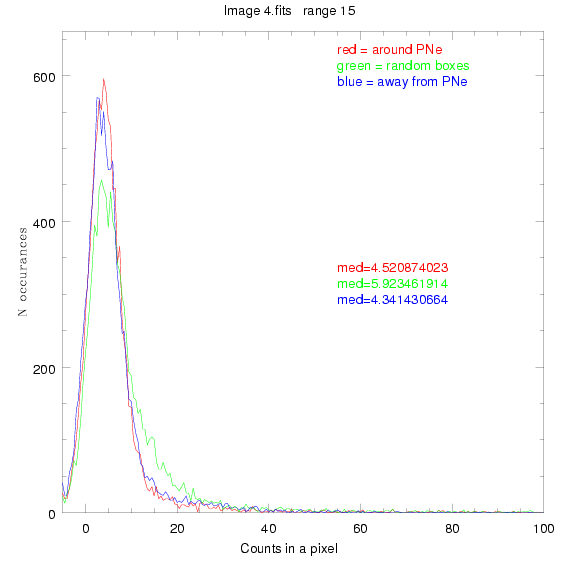
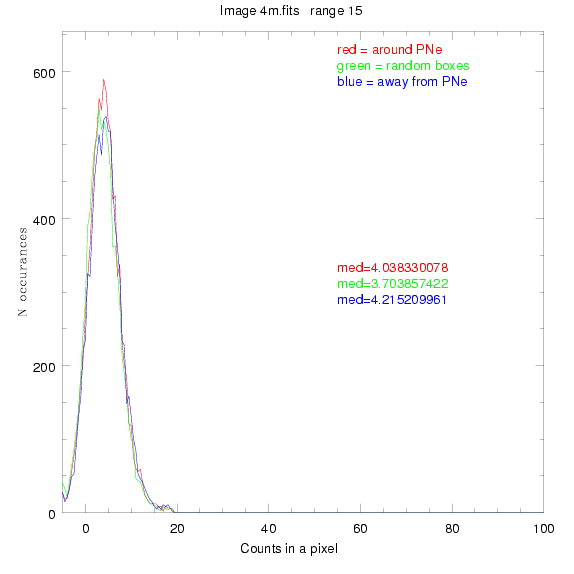
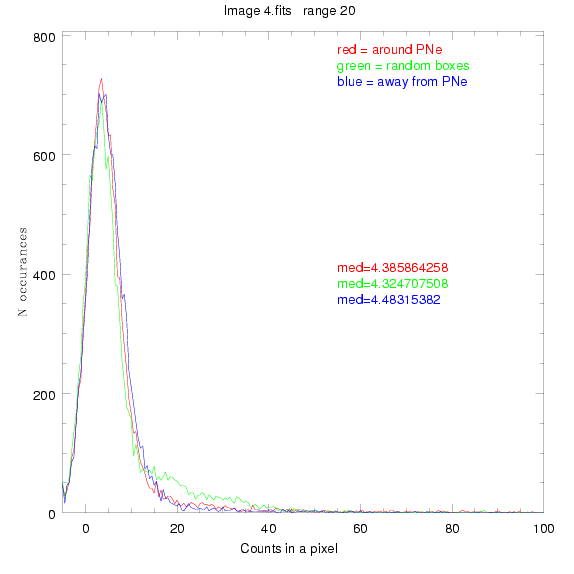
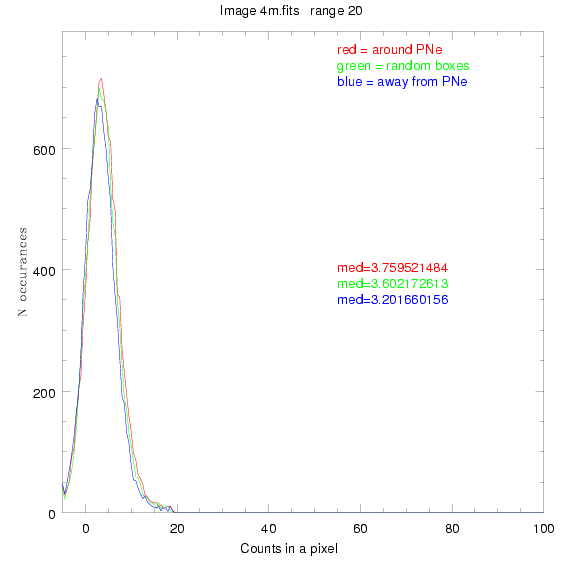
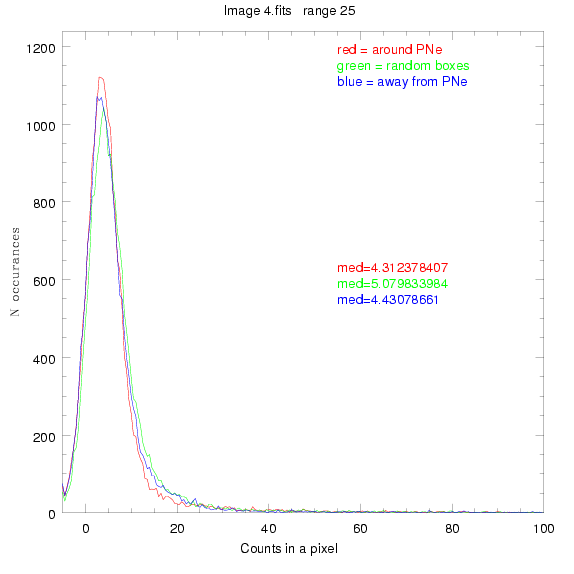
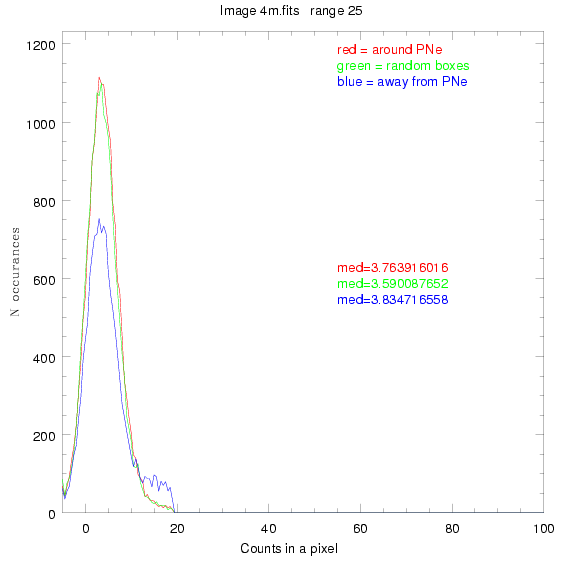
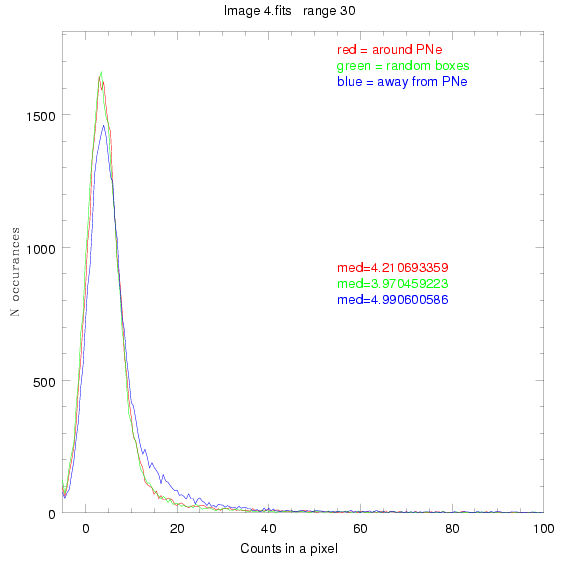
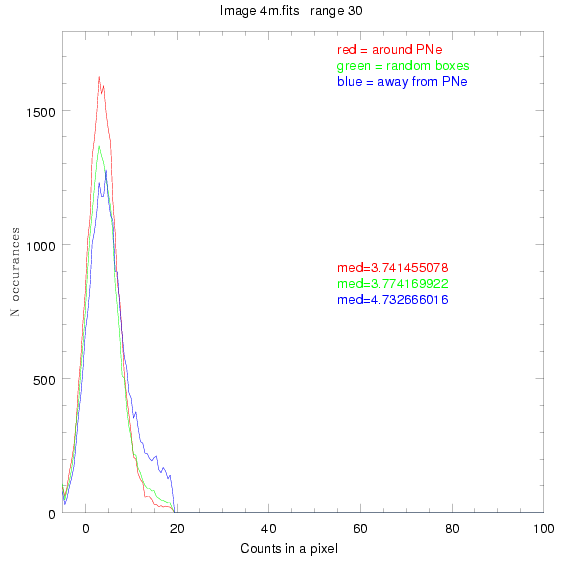
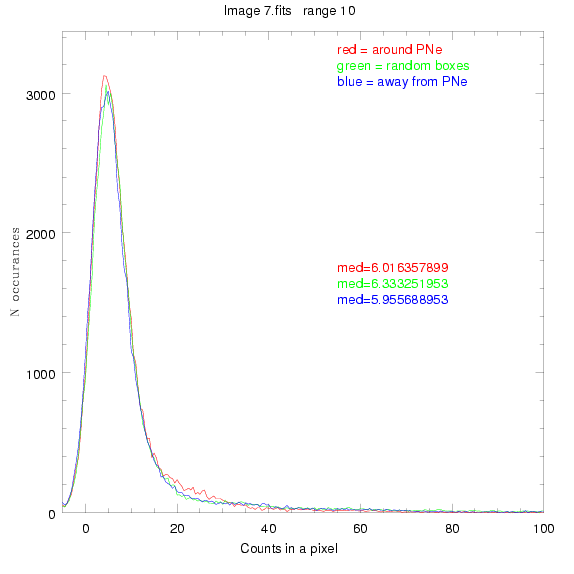
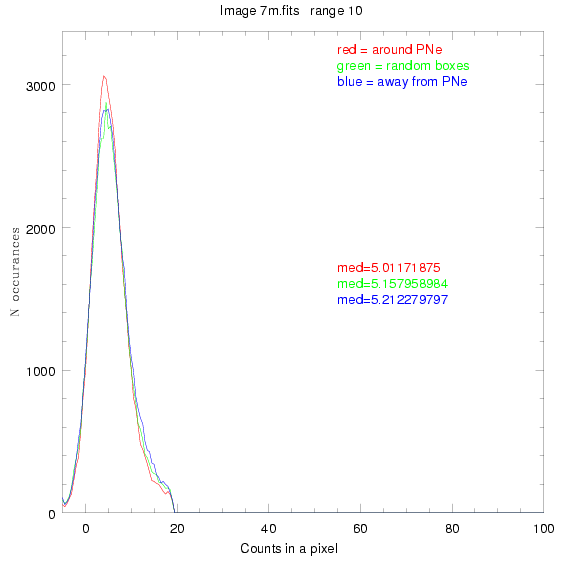
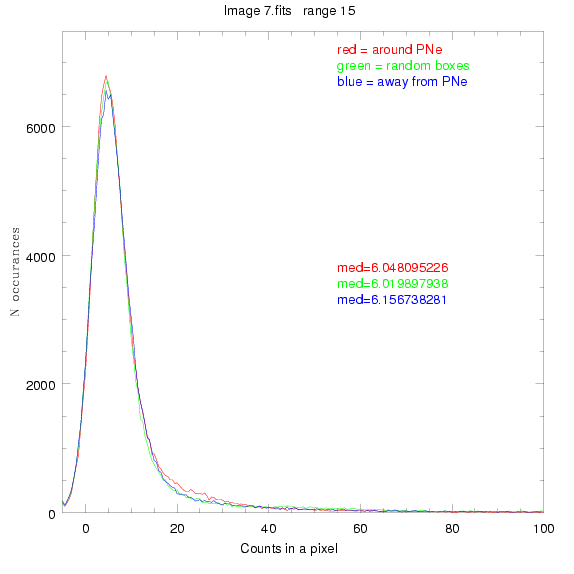
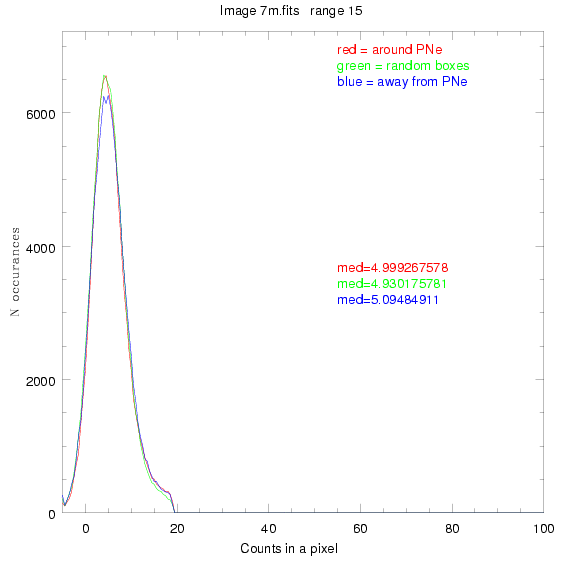
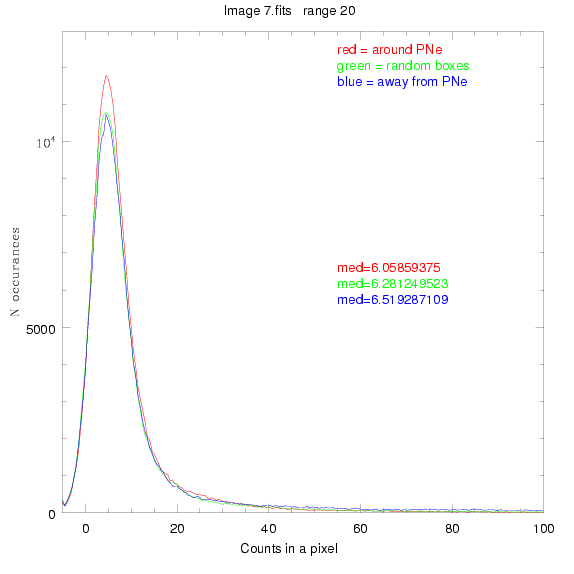
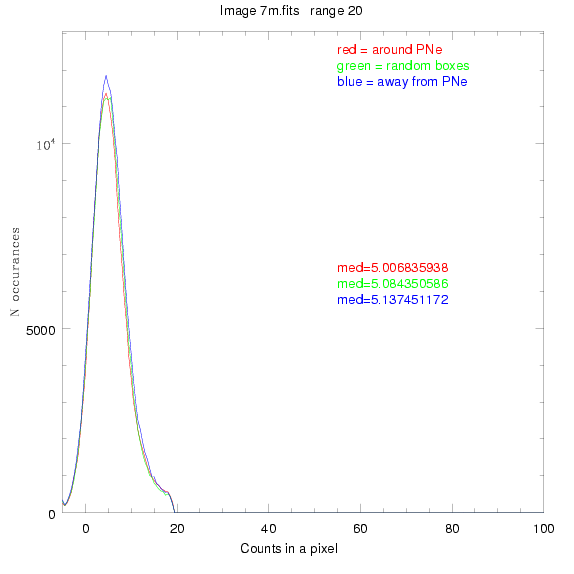
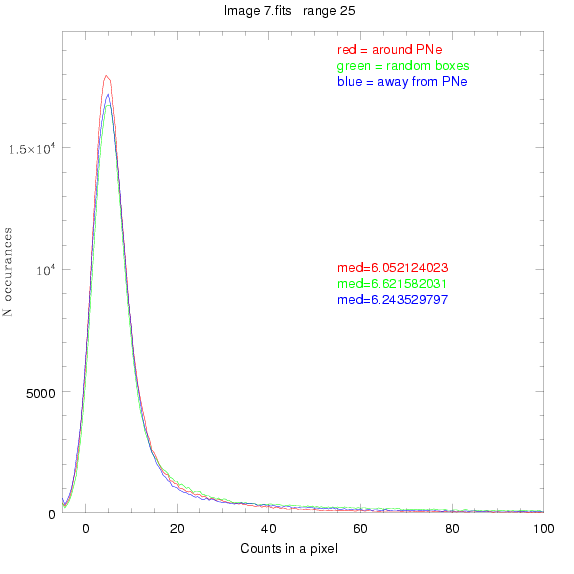
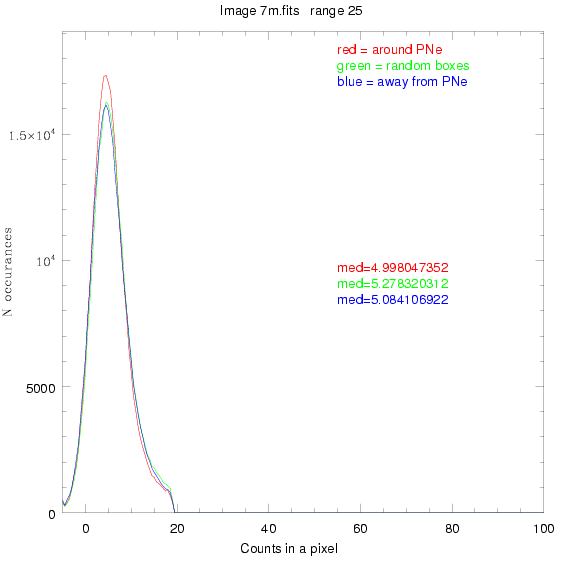
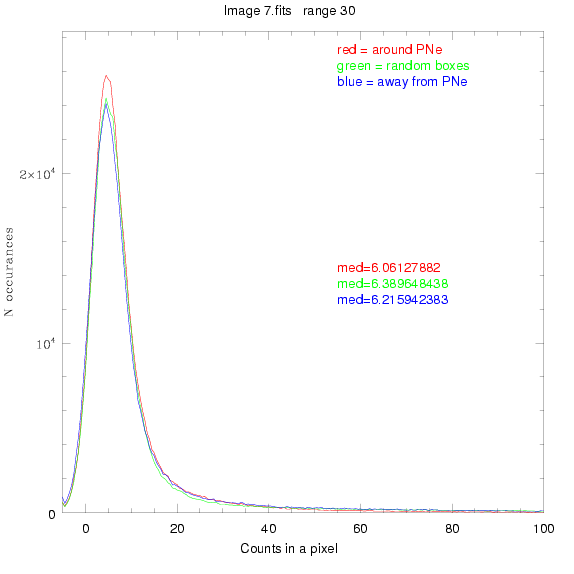
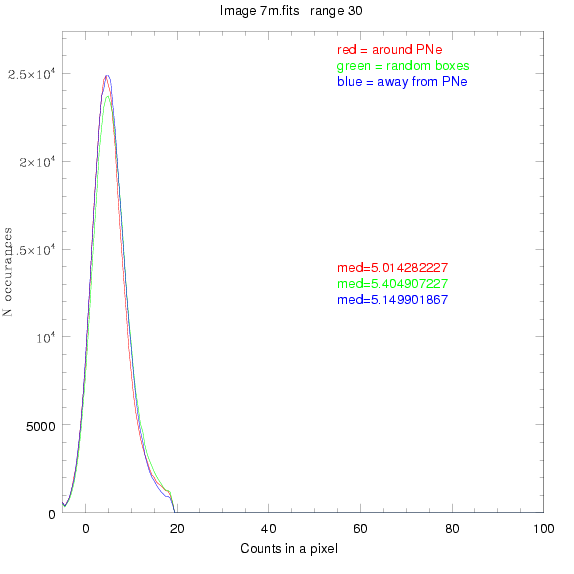
To select our regions we used three methods:
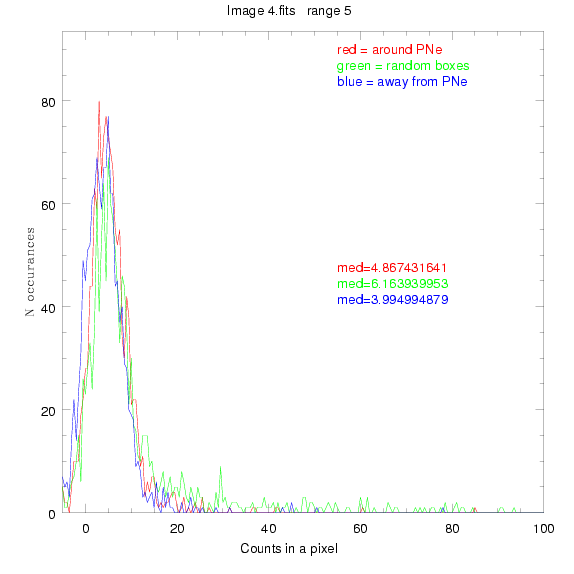
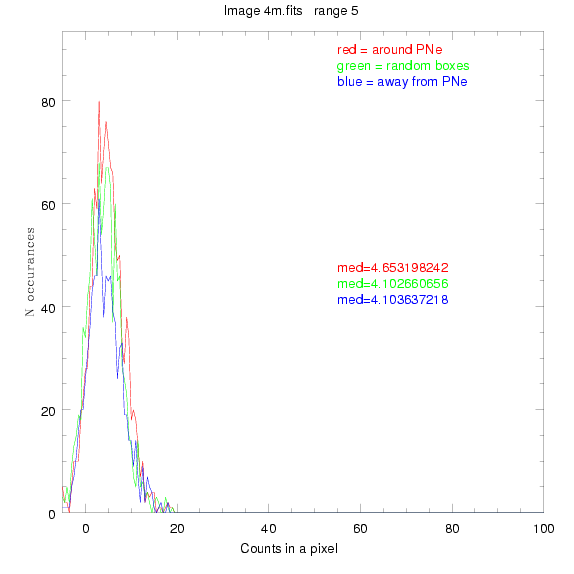
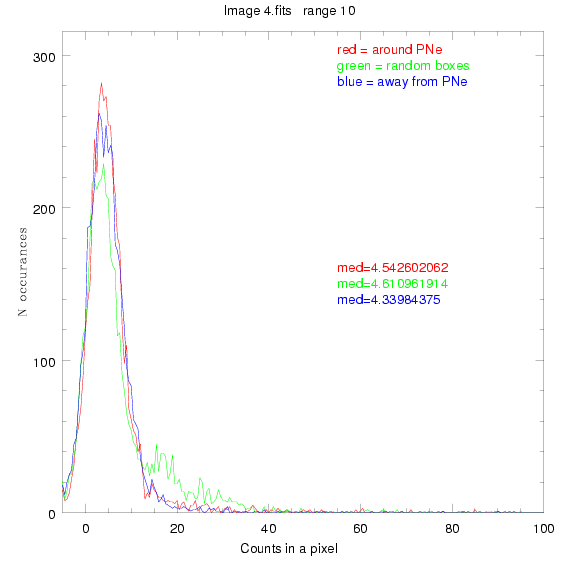
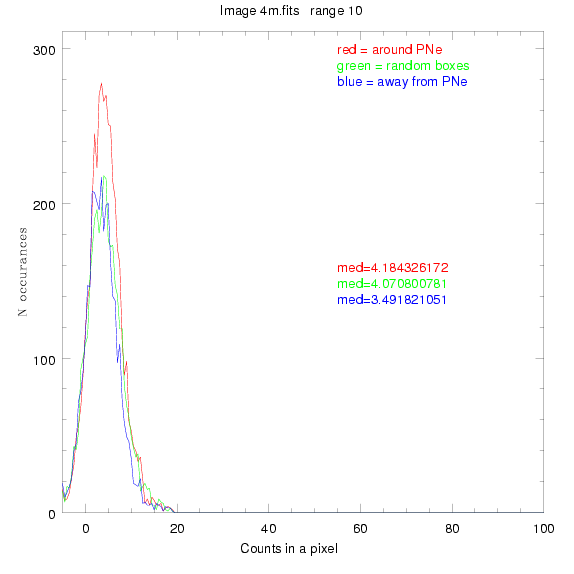
1) (red)
center each region on a PN, so that there are as many regions as PNe
2) (green)
center each region randomly in the image, but only select as many
regions as there are PNe, for consistency
3) (blue)
select each region randomly but make sure that it contains exactly ZERO
(0) PNe
These three methods are applied on the masked and unmasked
images (side by side) with ranges (related to size of region) of 3, 5,
10, 15, 20, 25, 30, 35.
For each field (masked or unmasked), the median of each method was also
determined and is shown on the graph as "med=##"
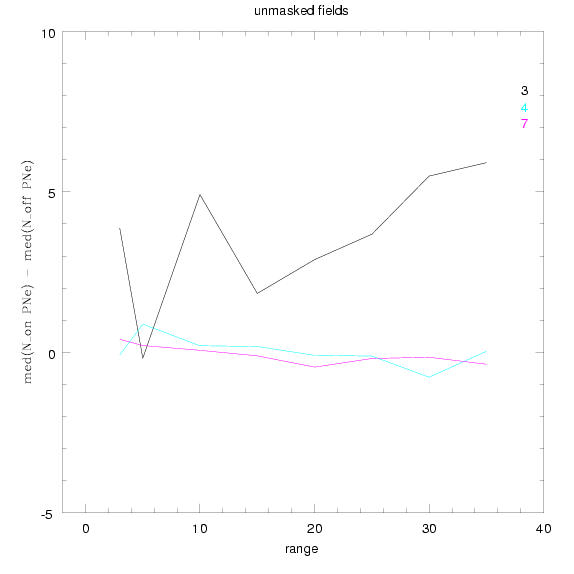
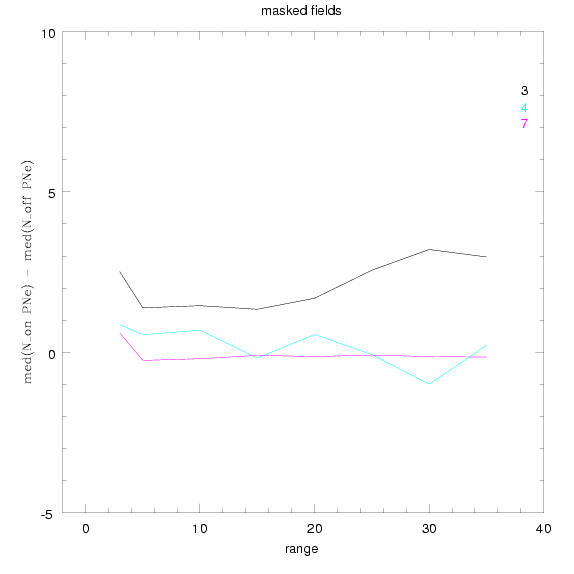
These medians are collected and plotted as a function of range, shown at the bottom
of this page.
This was performed on 3.fits, 4.fits,
and 7.fits, using PNe catalog data from Feldmeier.
code: PNe2.sm PNe2 <-- goes through and generates all the .ps files
as shown converted to .gif below and stores median values in meds.dat
PNe2.sm PNe2m
<-- takes data file meds.dat and generates bottom two figures
3.fits
4.fits
7.fits
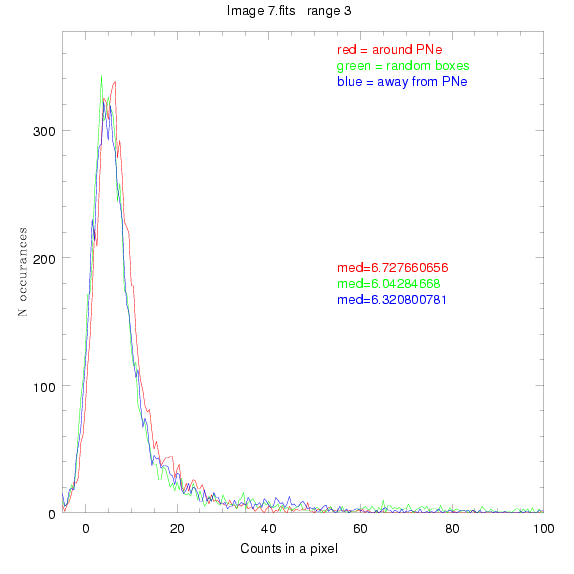
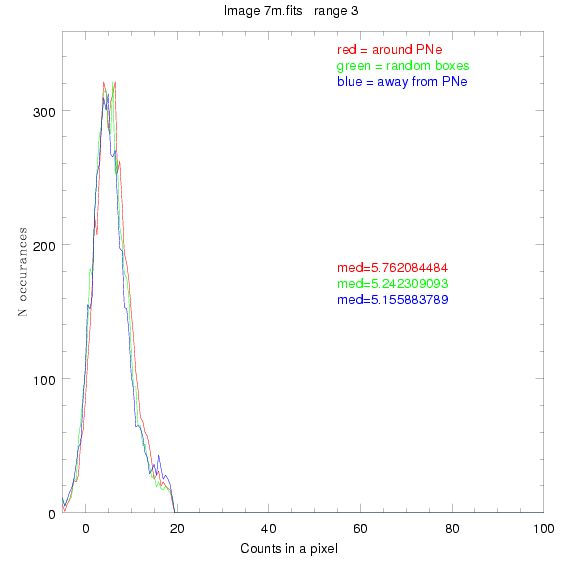
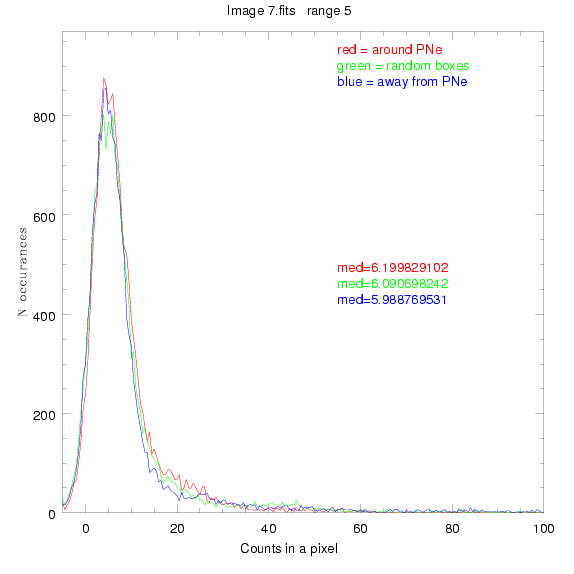
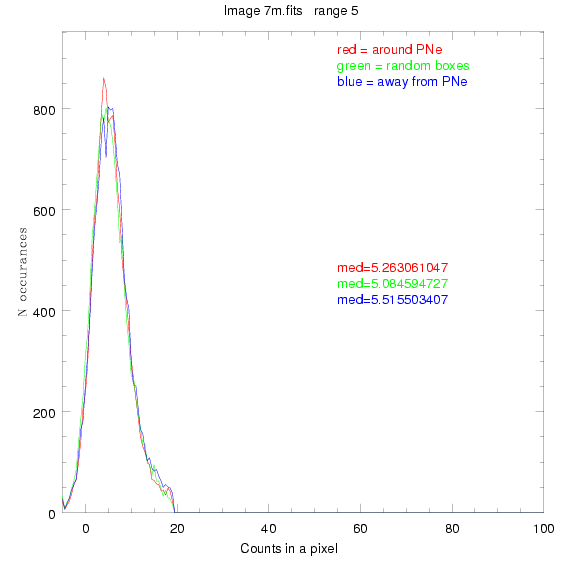
Overall Comparison of Medians
In these plots, the selected ranges used are the same as the
above
images: 3, 5, 10, 15, 20, 25, 30, 35.
The quantity on the y-axis reflects the difference between the median
value of our fields located ON PNe and the median value of our fields
located OFF PNe, that is, without any in them.
back to the top
Better eh? What next? Let's make
histograms that include a new value: light in regions with 2 or more
PNe, and let's mask only down to u = 25, not u = 26
Back to previous PNe stats page
Back to MCu stats page
Back to main Virgo page


