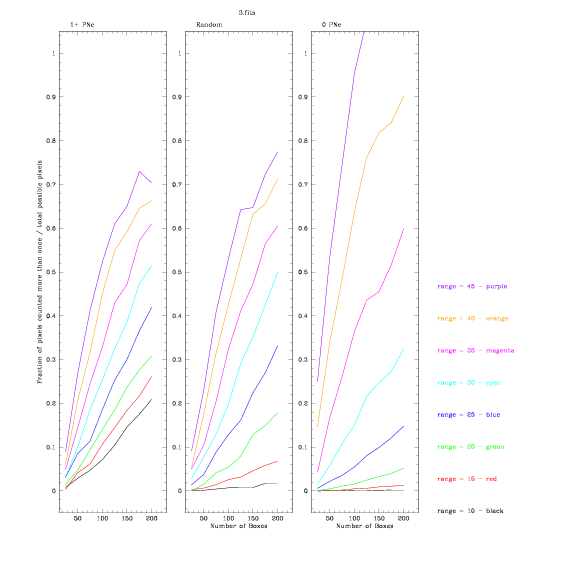
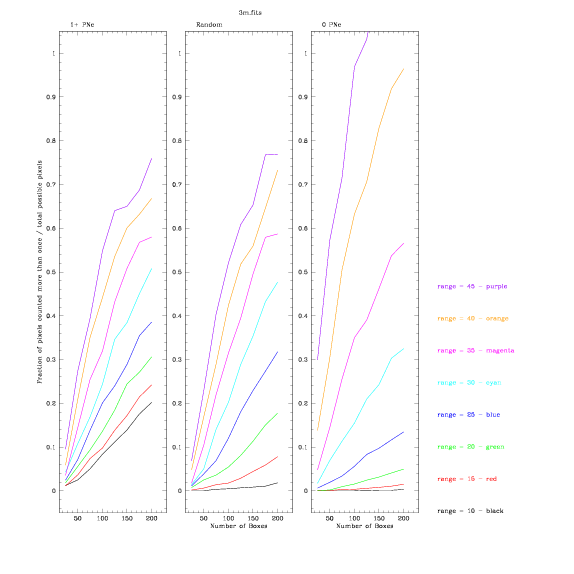
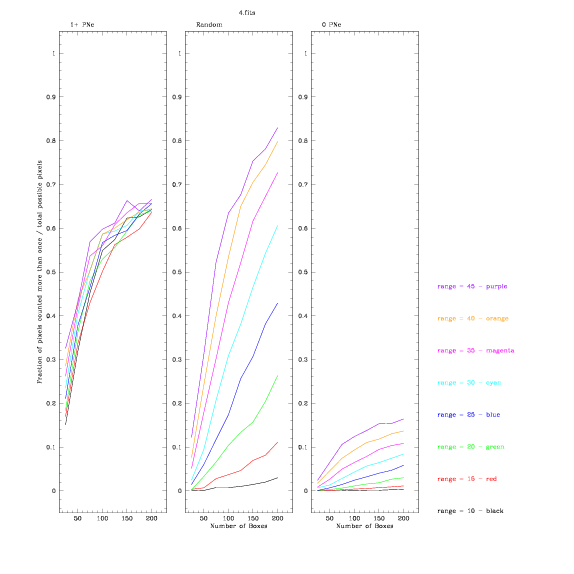
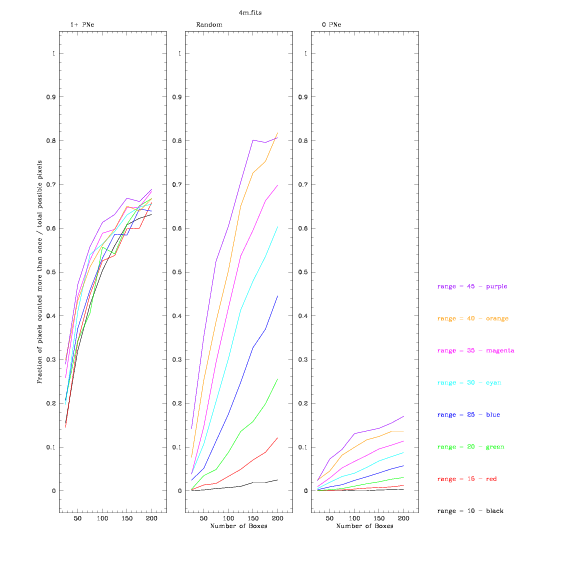
Checking on over-sampling of data with our box methods
Idea -- > Try to
get a feel for how over- or under-sampled our data
is for different box sizes, numbers of boxes, and in different fields.
It is important to understand how adjusting these parameters changes
the sampling of the data. The ranges are varied from a Half-Box Width
of 10 up to 60, which correspond to Box Widths from 30" to 175". The
number of boxes is varied from 25 to 200 in steps of 25. We use fields
3, 4, 7, and Sub, with and without our masks (hand masks + u>25 mask
+ sextracted/monte-carlo mask).
Code Outline: clicking on the links will take you to that section of
the code - it's online, too, on a separate page.
Code --> PNeNstat.sm PNeNstat -
preps colours, variables, running parameters, loops and calls PNew
(always), PNeNdat, PNemax, PNeD, PNeG (all sometimes)
PNeNdat - runs 3 box programs - 1+ PNe, 0 PNe,
random
PNew
- reads in .fits
info and
loads PNe RA/DEC data
PNe1
- finds
coordinates of random boxes with at least 1 PNe in them [by the same
method as given on PNe8 page]
saves
to a file
8.100.Im3.fits.R10.wfound.dat [with 100 boxes, image 3.fits, range 10,
w = 1+ PNe found] the RA/DEC of boxes
PNe0
- finds
coordinates of random boxes with NO PNe in them
saves
to a file
8.100.Im3.fits.R10.0found.dat the RA/DEC of all boxes
PNer
- finds
coordinates of random boxes without stipulation on # PNe
saves
to a file
8.100.Im3.fits.R10.Rfound.dat the RA/DEC of boxes
PNePG -
small program that prepares
graphing stuff
sets
device, sets overall limits, draws all
axes/labels
PNeD
- reads back in
the positional .dat files from above and computes # pixels counted more
than once
calls
PNePG to prep graphs
for each box selection method: 1+PNe, 0PNe,
random: [links below are examples for
1+PNe method, others are very similar]
reads in .dat
file
sets up
'image' (2D matrix) same size as image to store # times counted
as each pixel value
loops
over all boxes, adds 1 to pixels
inside each box
loops
over all pixels, adds 1 to counter if
a pixel has value > 1
writes
to file
8.100.Im3.fits.R10.wfound.N.fits the 'image' array in case we need to
look at it again
divides
# pixels counted more than once by
max pixels possible (from PNemax programs) to get fraction
plots
on appropriate window of plot this fraction
after 1+ PNe, 0 PNe, random are done,
writes all fractions out to
file: 8.N.Im3.fits.R10.found.N.dat
PNeG
- program to JUST
graph data if all .dat files have already been generated and can just
be re-read
PNemaxread-program to read in
max values if they've already been
calculated and stored in *.max files
PNemax
- runs the max
finding programs,
listed below, and writes out
.max file after they've finished
PNe1max - loops over all pixels, on each
one, checks
if it is within 2*rang+1 of a PNe AND unmasked,
if so, adds to counter
PNe0max - loops over all pixels, on each
one, checks
if it is farther than rang+1 of a PNe AND unmasked, if so adds to
counter
PNeRmax - finds
total number of unmasked pixels
Results
NOTE: at this time (6/13/06 @ 2 pm) the 0 PNe graphs are not properly
normalised for each range... the shapes are correct, but the amplitude
of each curve is wrong relative to the other curves and to the scale on
the axis. The problem has been corrected and the graphs will be remade
and uploaded in a day or two.


7.fits 7m.fits
Sub.fits Subm.fits
back to main Virgo page


