Comparing our data with the literature
(Silly them, no error bars, and no Vizier data - hooray for typing
numbers from .gif files...)
This is done in 3 parts:
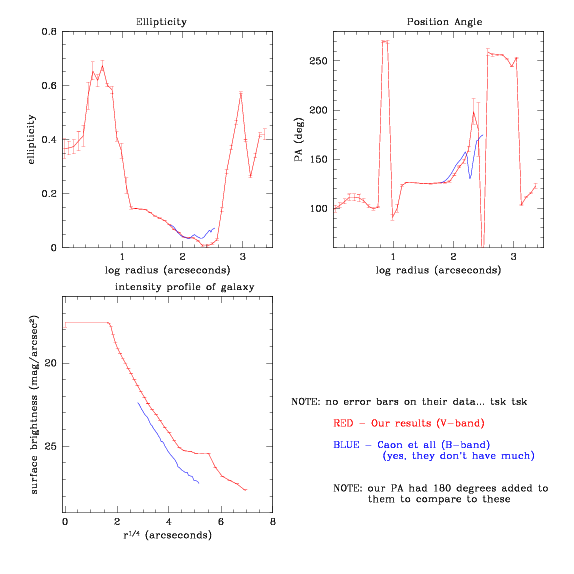
Comparing our fits with fits from the
literature: M84 M86
Comparing our colors with literature: M84 M86
Comparing our final subtraction with
radio/other/etc images: M84 M86
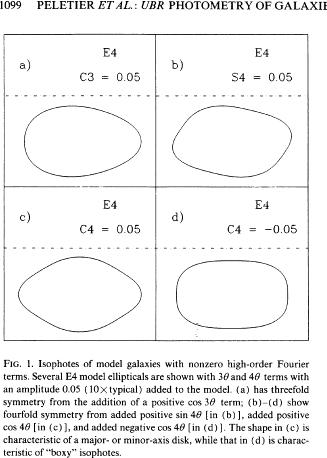
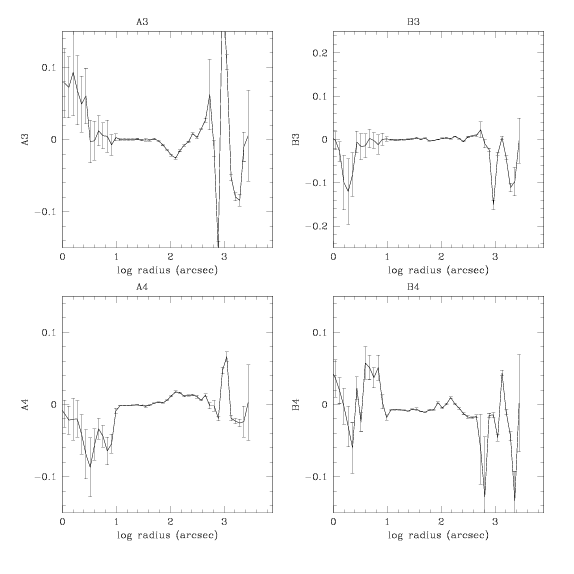
Don't forget, here's what disky and boxy isophotes look like/mean
for M84:
Comparing
fits
from Caon et al (1990)
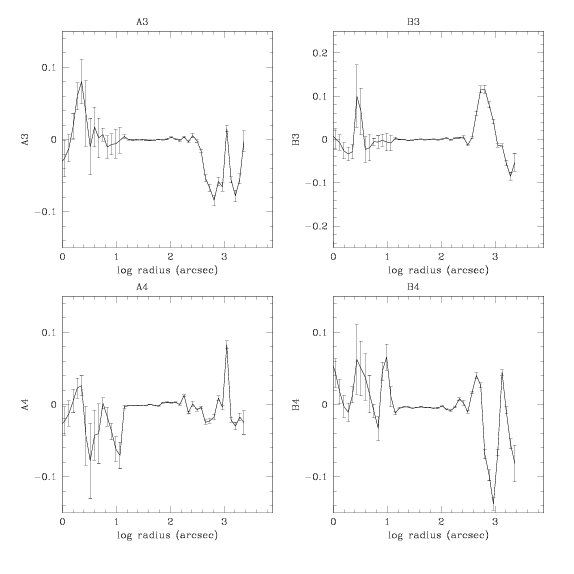
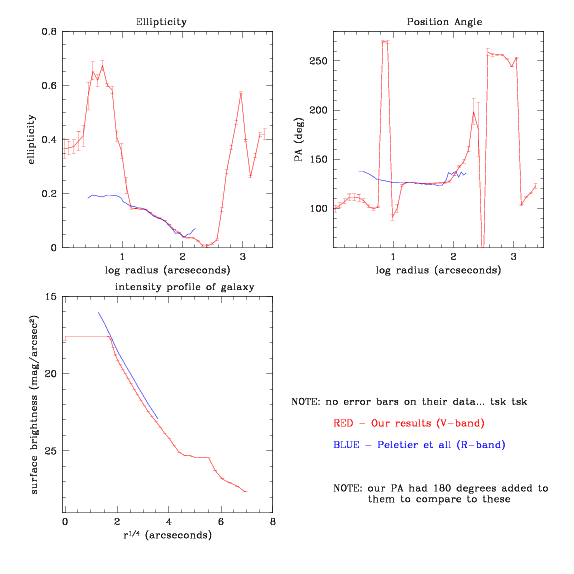
from Peletier et al (1990):
NGC4374 (M84):
This large galaxy filled the CCD frame and since it is round in the
outer parts the sky was difficult to determine and is uncertain. Note
that there are considerable amounts of dust in the central regions
(see, e.g., Hansen et al. 1984), which affected all Profiles. From the
fourth-order term, we conclude that NGC4374 is slightly boxy between
10" and 50". The seeing in U
was much worse than the seeing in B
and R. The ellipticity
profile is somewhat unusual in that it decreases monotonically outwards.
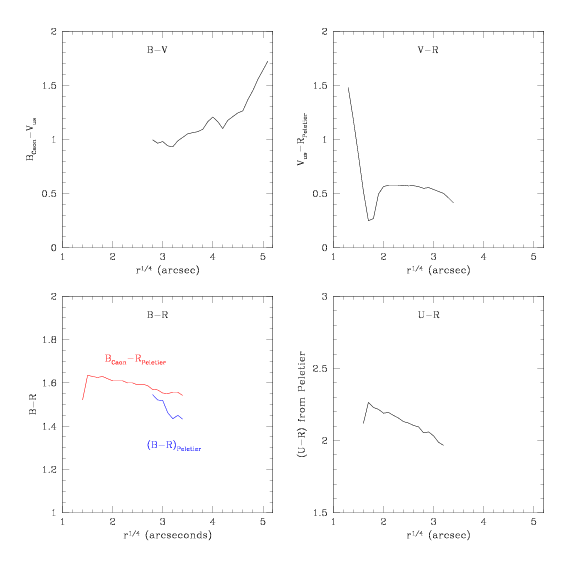
Colors
for M84 (NGC4374):
After a bit of interpolation/etc to get evenly spaced data points, I
used the followed data to make this plot: (with plotM84color.sm)
Our data - V-band
Caon - B-band
Peletier - R-band
- B-R
- U-R
Subtracted
image of M84:
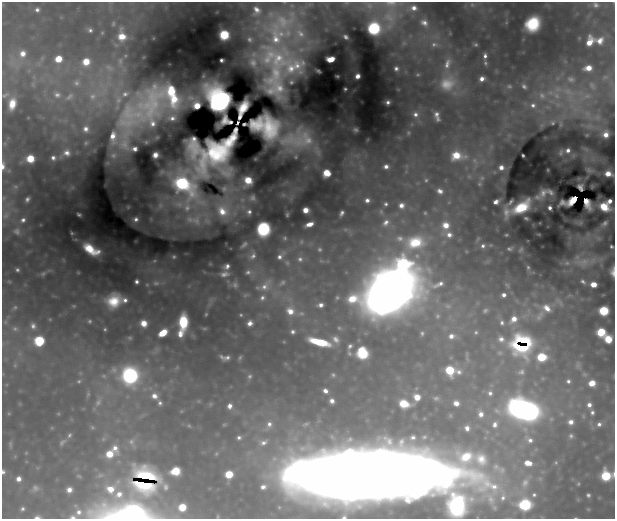
[Msubtract252.jpg - Msubtract.fits, rmed with i=2, o=5 to
Msubtract25.fits]
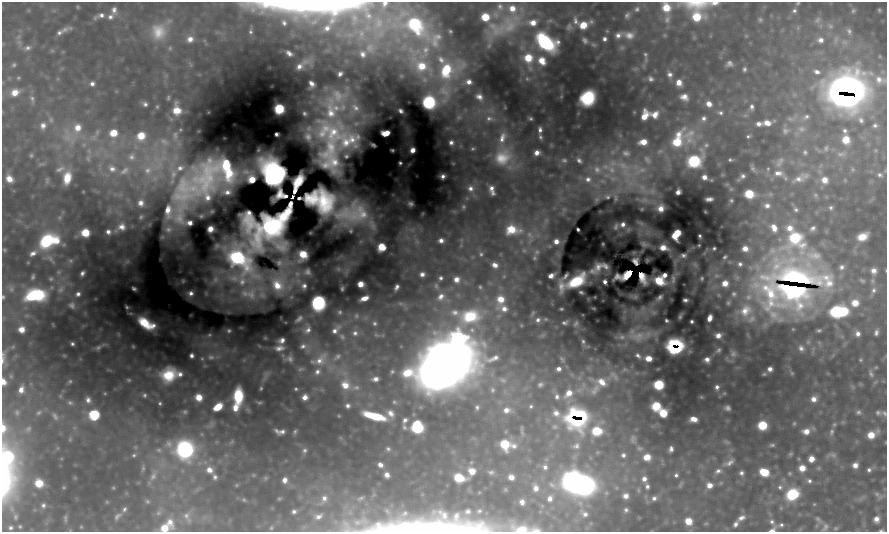
...nothing to compare this with yet, for M84... there is for M86 -
scroll down!
for M86:
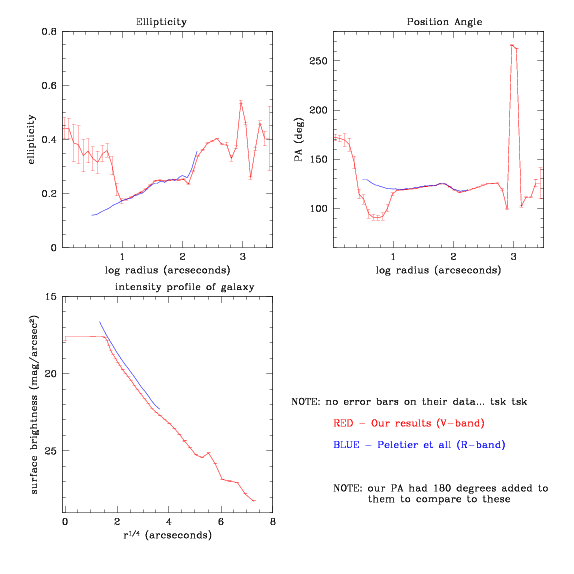
Comparing fits
from Caon et al (1990)
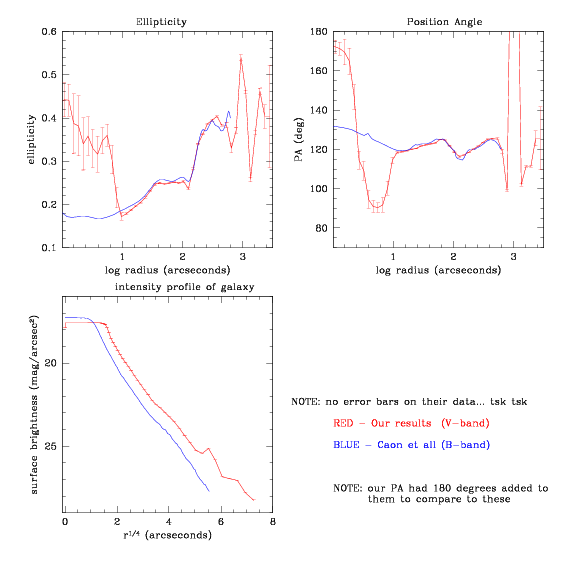
from Peletier et al (1990):
NGC 4406 (M86):
Again the galaxy completely fills the CCD fram so that the sky level is
uncertain. NGC 4406 is also a minor-axis rotator, like NGC 4261 (Bender
1988; Illingworth and Franx 1988; Franx, Illingworth, and Heckman
1989a), but with a kinematically distinct core rotating around the
minor axis. Apparently the core and the main boxy of the galaxy are
decoupled. Interestingly, the isophotes are "boxy" outside the core,
just like NGC 4261.
Colors
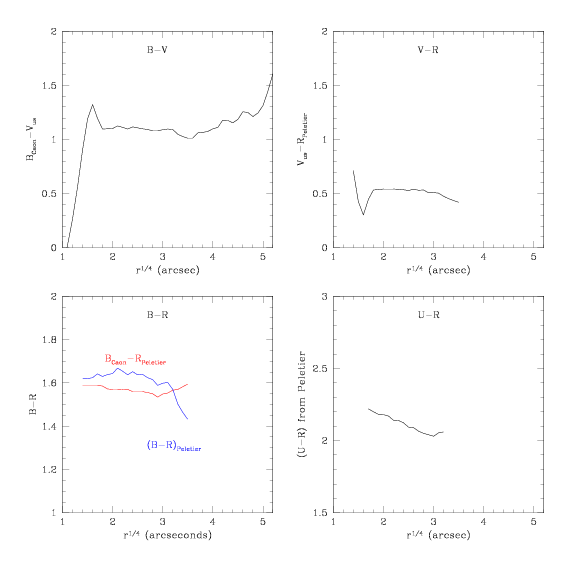
for M86 (NGC 4406):
After a bit of interpolation/etc to get evenly spaced data points, I
used the followed data to make this plot: (with plotM86color.sm)
Our data - V-band
Caon - B-band
Peletier - R-band
- B-R
- U-R
Subtracted
image of M86:
[Msubtract252.jpg - Msubtract.fits, rmed with i=2, o=5 to
Msubtract25.fits]
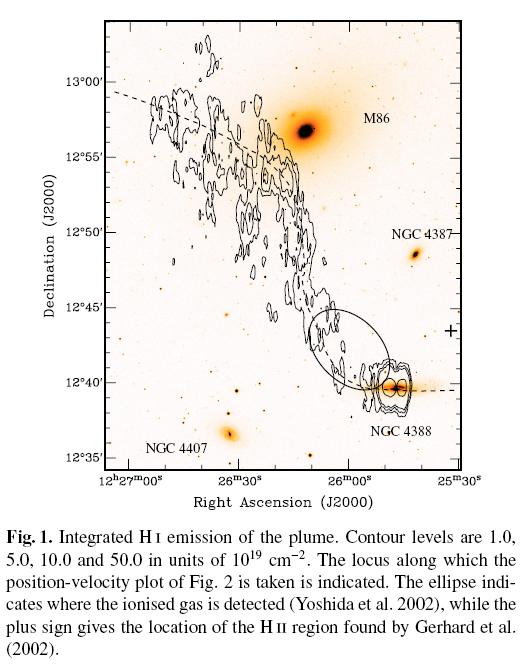
[from VanGorkum & Oosterloo 2005]
