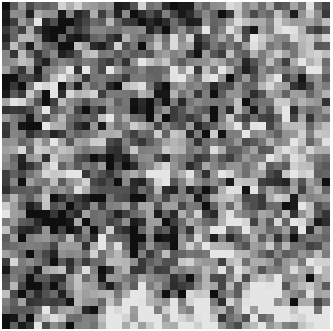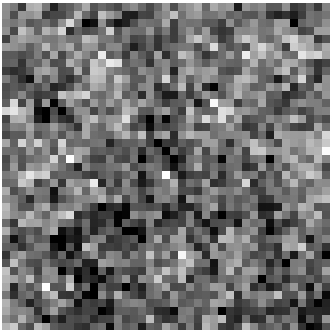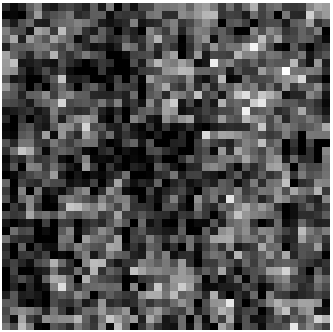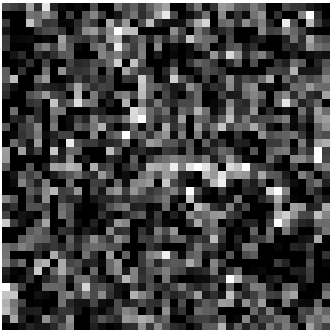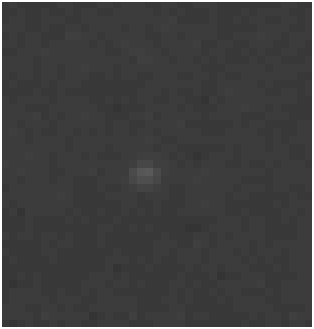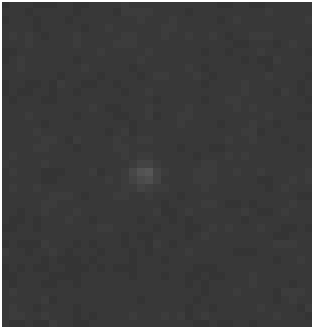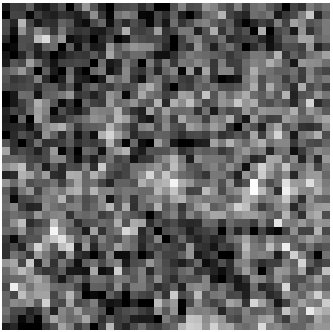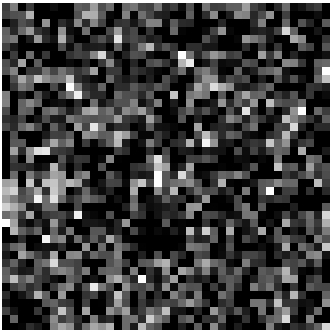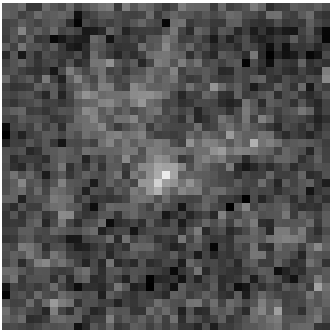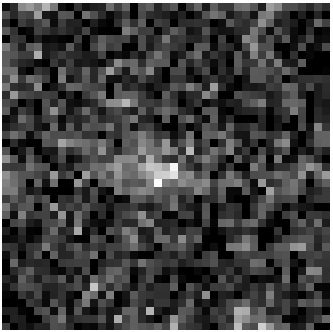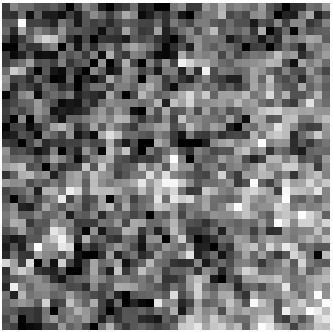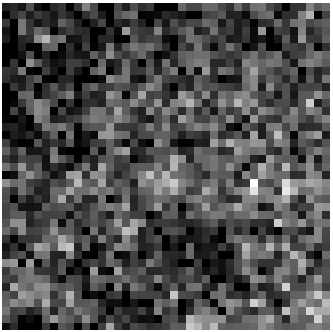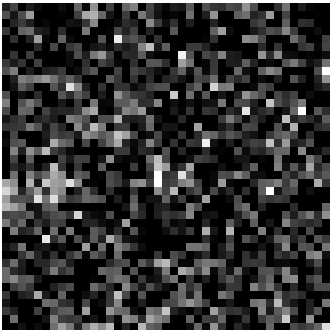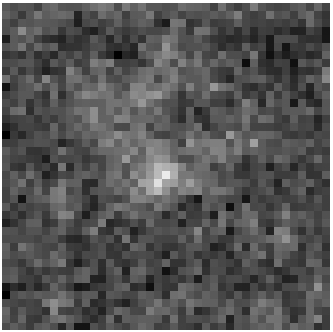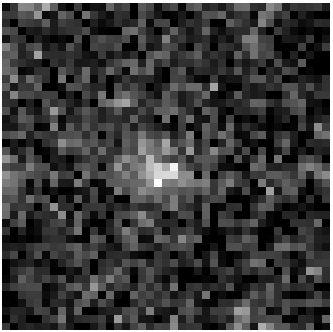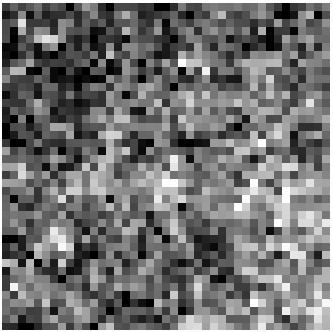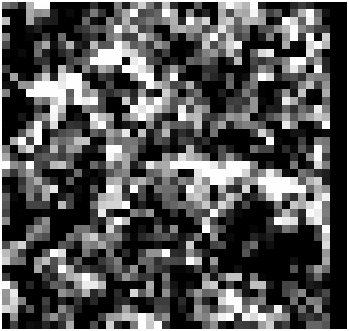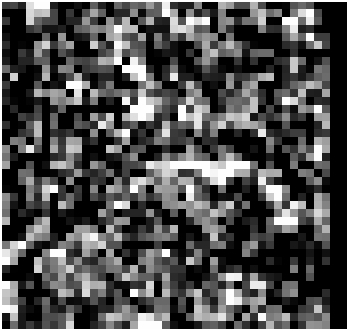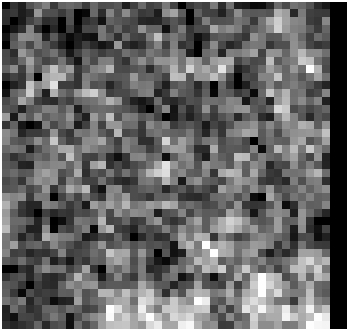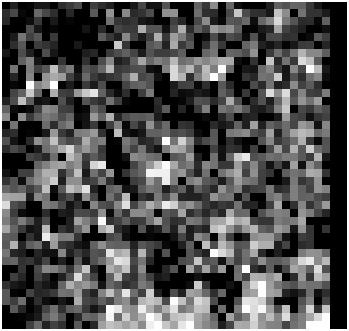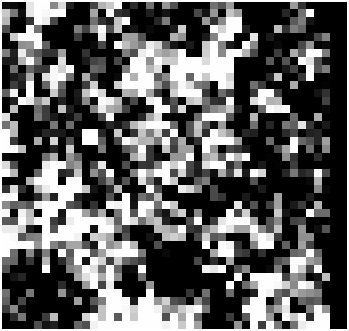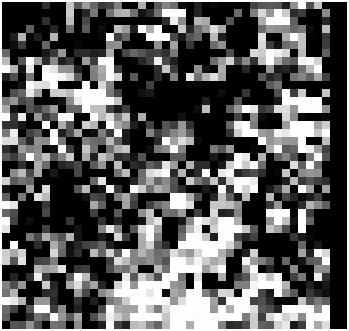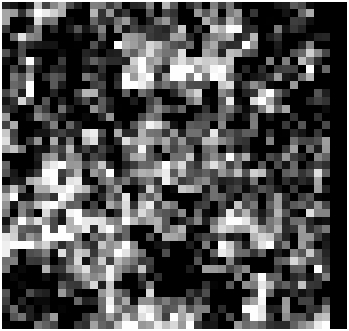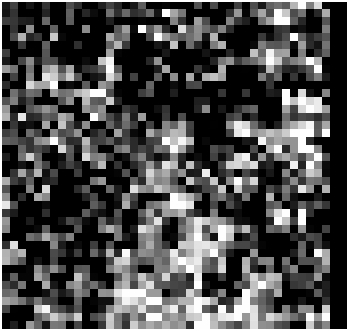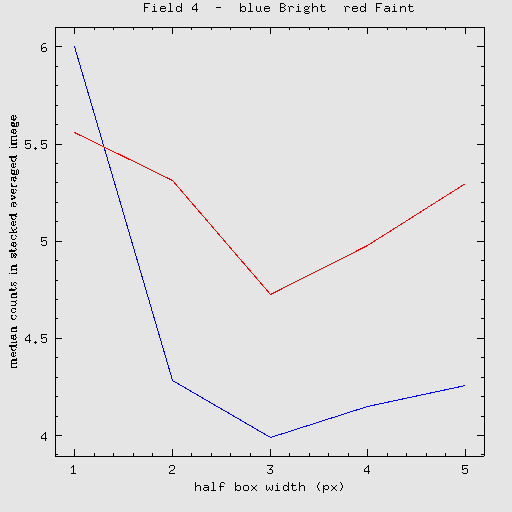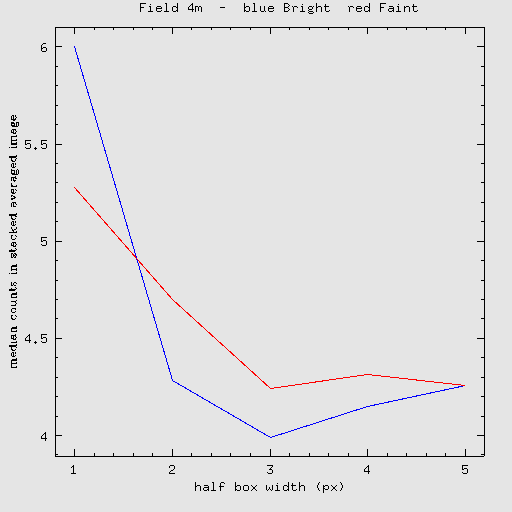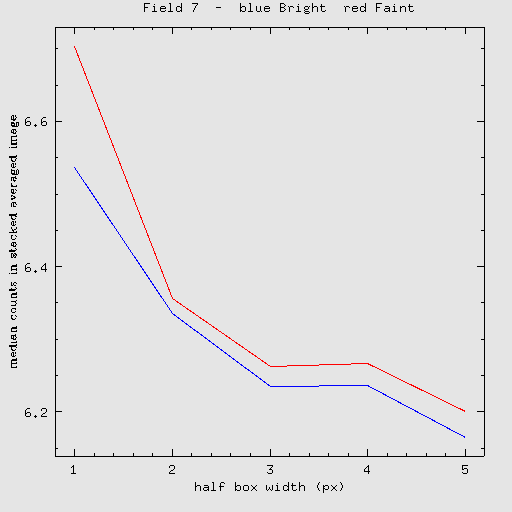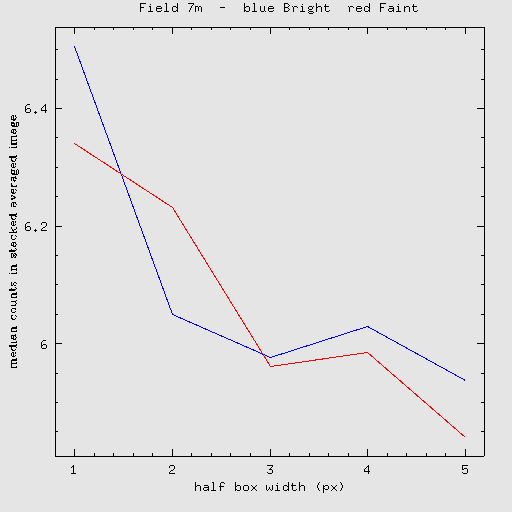
Can we SEE the PNe in our images???


Don't think so...

Here's how:
Using IRAF (not supermongo, like all of the other statistical analysis), we collect the pixels around each PNe in a box that is 40 pixels wide. These images are co-added with IRAF's imcombine command, adding medians.

This procedure was performed using the catalogs of observed PNe from Feldmeier and Aguerri as well as on the theoretical data generated for use in one version of our statistics.
For the theoretical data, the same 20 versions of the sub-sampled data set used in the statistics were used here - all 20 sets of PNe are combined.

NOTE on 4: the pixels were only collected in a box 20 pixels wide as many of the (small number of) PNe were close to the edge of the image
NOTE on masked vs. unmasked: there will be less PNe found in the masked images (and thus less images co-added) because PNe are ignored if they are found in a pixel that has been masked

Don't like the stretches/scales on the images? Download the fits files by clicking the link below each image and stretch/scale them yourself.

[skip to results]

The code is in multiple sections that interact:
/Virgo/FeldPNe/cPNe/findPNe.sm  -  findPNe   -   program to convert RA/DEC coordinates of PNe into pixel values for each image
                                                                                 define box size [then add 1 to it, so it works right - has to do w/ sm starting vectors with 0]
                                                                                 set images to run on
                                                                                 calls findPNew [made separately to fix sm's max # lines in a macro problem]
                                                           findPNew  -  read in desired image and necessary fits header info.
                                                                                 loop over all entries in the catalog
                                                                                 convert RA,DEC to x,y
                                                                                 check if it's within this image (with space to take a box around it)
                                                                                 write out resulting coordinates to file
/Virgo/FeldPNe/cPNe/imcopy.sm    -   imcopy   -   program to generate a file of IRAF commands to generate all of the small images around each PN
                                                                                 defines image and range of interest
                                                                                 reads in appropriate data file
                                                                                 using defined range, generates the imcopy commands to grab sections of the image around the PNe
Next, the imcombine command was used in IRAF to co-add all of these images together, excluding pixels with values higher than 25 or lower than -25 [this handles masking when applicable]. A sigma clipping is also applied to the images, cutting values with sigma > 3 or sigma < -3.

Results:
Unmasked REAL data
Masked REAL data
Unmasked Spectroscopically confirmed data (Feldmeier only)
Masked Spectroscopically confirmed data (Feldmeier only)
"Field 1" results
Unmasked FAKE data
Masked FAKE data

Unmasked Real data:
3.fits 4.fits (only 20 pixels wide, see note)
7.fits
71 co-added

fits file
8 co-added

fits file
81 co-added

fits file
Core.fits
FCJ.fits
LPC.fits
97 co-added

fits file
37 co-added

fits file
~10 co-added

fits file


Masked Real Data
3m.fits 4m.fits 7m.fits
71 co-added (wonder why this is less than before?)
fits file
8 co-added

fits file
81 co-added

fits file
Corem.fits FCJm.fits LPCm.fits
97 co-added

fits file
37 co-added

fits file
~10 co-added

fits file


Unmasked Spectroscopically Confirmed PNe (from Feldmeier)
3.fits 4.fits 7.fits
45 co-added

3 co-added

32 co-added


Masked Spectroscopically Confirmed PNe (from Feldmeier)
3m.fits 4m.fits 7m.fits
45 co-added

3 co-added

32 co-added


7.fits with Field 1's data only
7m.fits with Field 1's data only

~70 co-added

~70 co-added


Unmasked FAKE data
3.fits
4.fits
7.fits
1871 co-added

fits file
236 co-added

fits file
3759 co-added

fits file
Core.fits
FCJ.fits

2654 co-added

fits file
1861 co-added

fits file


Masked FAKE data
3m.fits
4m.fits
7m.fits
1871 co-added

fits file
236 co-added

fits file
3759 co-added

fits file
Corem.fits
FCJm.fits

2654 co-added

fits file
1861 co-added

fits file


back to top


Here is more info on this process/ideas.
We are probing deeply into the relationship of this procedure to that of our analysis code on the full images. (See here)

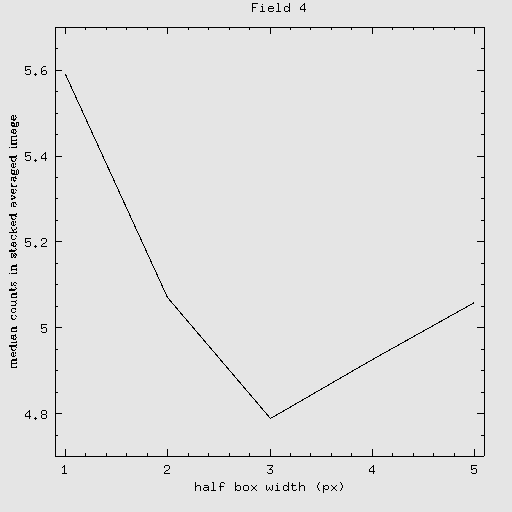
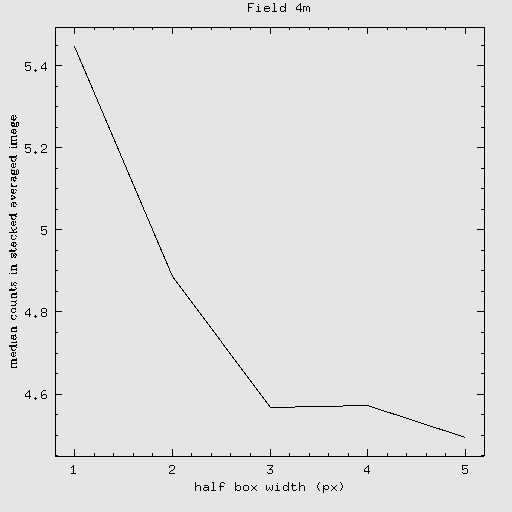
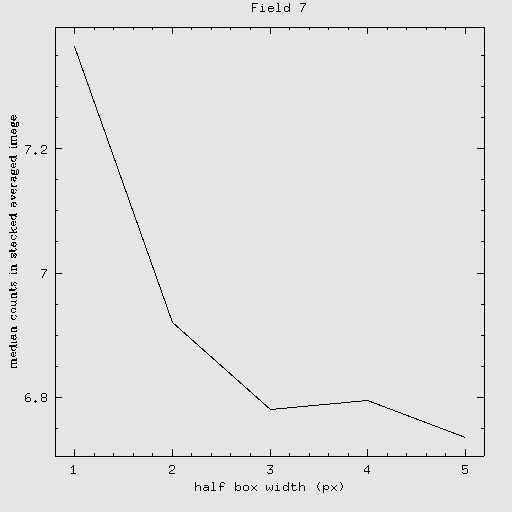
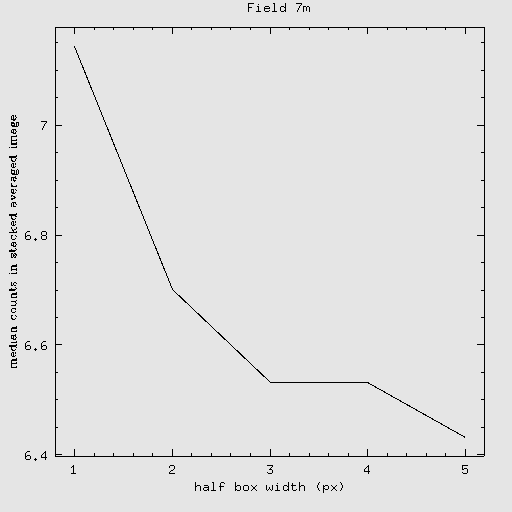
As the above images were made by 'co-adding' the medians of the individual images together, we are interested in seeing what they look like if averaged instead. For fields 4 and 7 (masked and unmasked) here are the Average-Combined Images:

4.fits 4m.fits


7.fits 7m.fits


Using THESE above images, statistics are done on various sized regions, starting from the center and moving out, analogously to the analysis code.
The same step sizes are used, with half-box widths of 1, 2, 3, 4, and 5, reflecting boxes that are 3x3, 5x5, 7x7, 9x9, and 11x11.


So the signature's there, faintly, even if we can't see it with our eye.

Next we try taking the catalog of PNe and sorting by brightness for each field, making 2 new catalogs: the brightest 1/3 of the original and the faintest 1/3. This will allow us to see which PNe are causing this trend we see. Re-doing the image stacking (averaging with no rejection) with the brights and faints we get:
Brights
Faints
4.fits
2 averaged

4.fits
2 averaged

4m.fits
4 averaged

4m.fits
4 averaged

7.fits
28 averaged

7.fits
28 averaged

7m.fits
28 averaged

7m.fits
28 averaged


Various box-sized statistics (to compare with primary analysis), as before:

Brights & Faints


back to main Virgo page