PNe26
[Just getting a page up to detail-ed-ly explain the code]
This version uses simulated data from PNe8alpha8 and runs statistics on
it.
Results on each field: [these are separate pages since there are SO
MANY graphs to display]
3/3m 4/4m 7/7m
Core/Corem
Sub/Subm LPC/LPCm
FCJ/FCJm
Code outline:
PNe.sm - PNe - Starting point of program, reads in v.v,
i.i, c.c, p.p to set running parameters
Sets images/ranges
to run and filenames to save things as
Calls PNe10, PNeR,
PNeG
pickgoodbox 4
Mini macro to
select a 'good' box center (same code in ALL analysis code now)
Uses limits of
image (pixels), statistics box size and 'mm' masked image to choose a
box center that:
1) is
inside the image AND has enough space to put a box around it
2) has
a center that is not on a masked pixel in the 'mm' masked image
Calls macro coo2wcs
4 to convert the x,y pixels to RA, DEC, and outputs all 4
coo2wcs 4
Very mini macro
that converts inputted x and y coordinates into RA and DEC
NOTE: relies on
fits header having been properly read (CRPIX/CD2_2/CRVAL/etc)
PNe10 - Selects and samples boxes with and without PNe
Main while loop,
loops while quotas aren't met for 0 and 1+ boxes
Calls
pickgoodbox to get x,y,RA,DEC coords
Uses
old faithful method of delRA/delDEC to find if there are any PNe in
this box
If a
PN (or more) is found:
First makes sure that we still need it (since the while
loop is for both 1+ and 0)
Saves RA/DEC in vectors, collects unmasked pixels, adds to
wPNe vector
If no
PNe are found:
Checks to make sure we still need it (again, while loop is
for both)
Saves RA/DEC, collects unmasked pixels, adds them to woPNe
vector
PNeR - Selects and samples random boxes
Calls pickgoodbox
enough times to build up a collection of random boxes
Saves coordinates
and pixels along the way
PNeG - Graphing part
First, writes out
data files, *.wfound.dat, *.0found.dat, and *.Rfound.dat
Histograms,
computes medians, writes *.med file (very important for later)
Generates *.ps
histogram for these 3 methods and saves it.
Looking for results? Links are at the top,
silly.
But wait,
you can still see something down here... Here are some sample
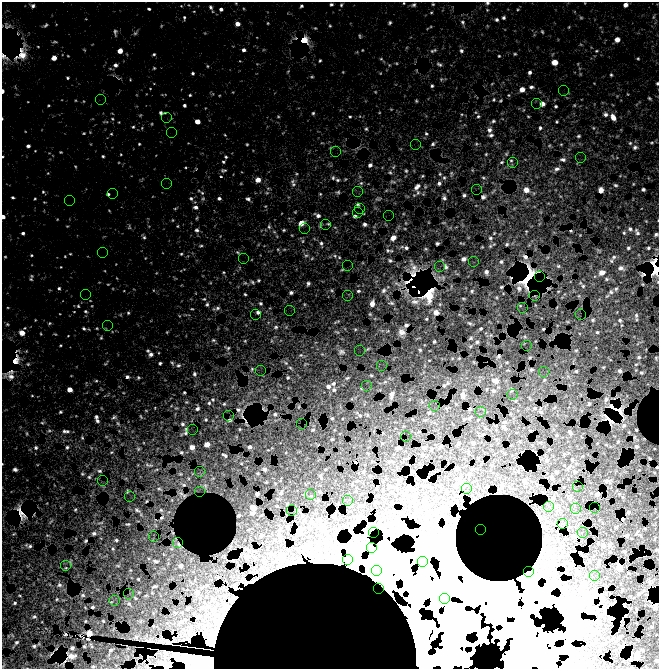
distributions of PNe generated by PNe8alpha8 for this section:
These are all images of the first catalog (only) for Field 3 (shown on
the MM mask that was used for theoretical generation)
0% contamination 10% catalog
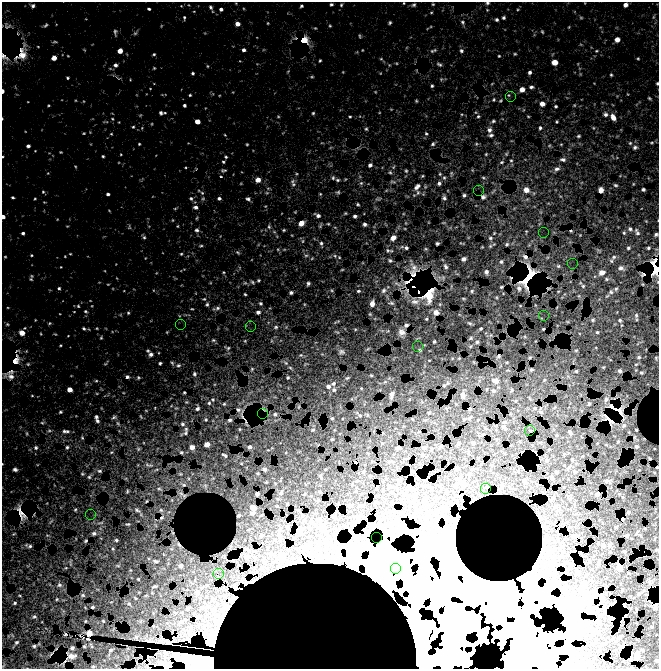
0% contamination 100% catalog
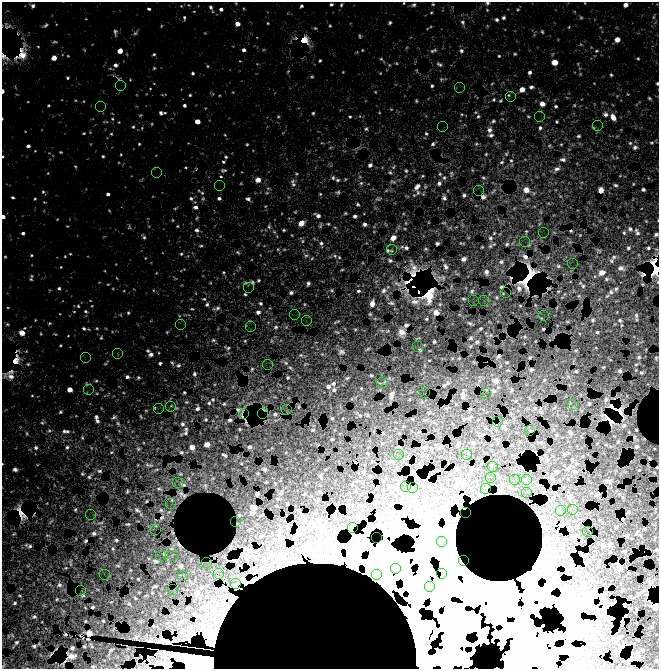
0% contamination 500% catalog
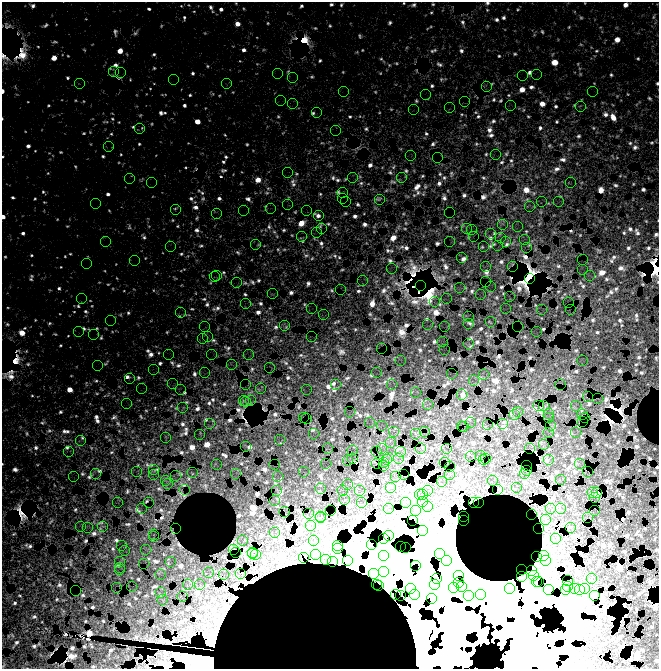
40% contamination 100% catalog [sorry,
contaminants used to be in red, but that code didn't work for this data
anymore]
100% contamination 100% catalog
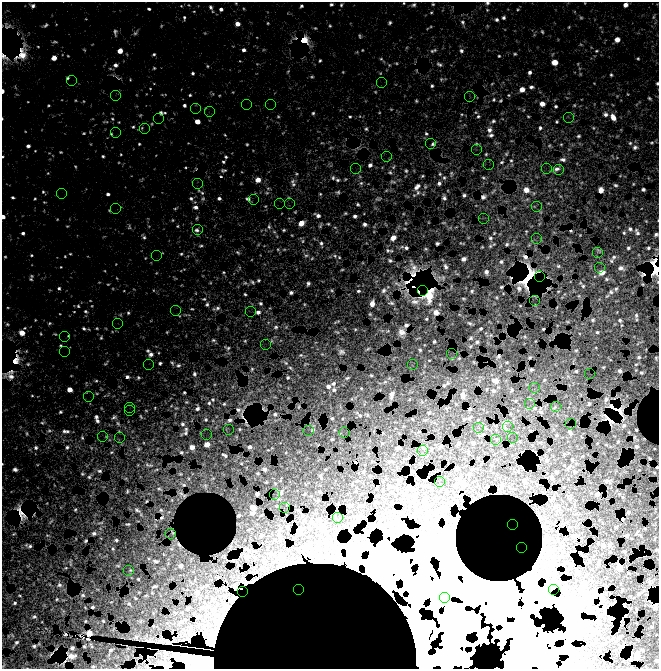
100% contamination 500% catalog
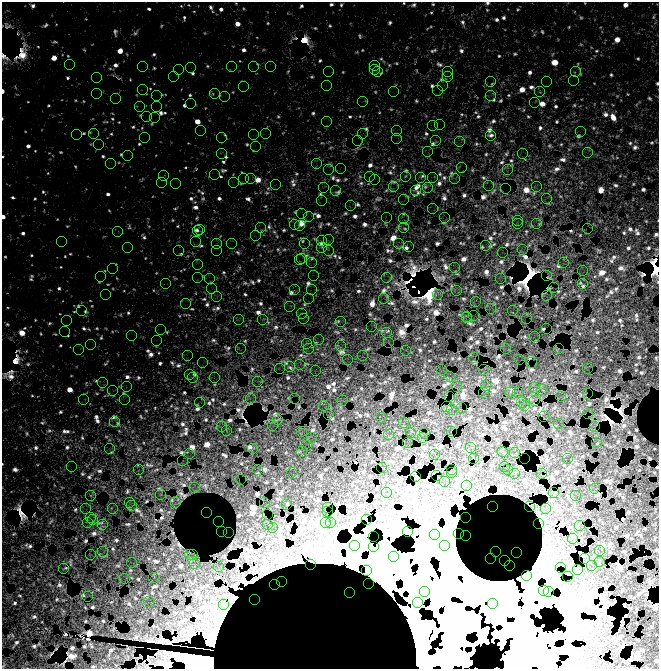
back to Final PNe Analysis Page
back to main Virgo Page


