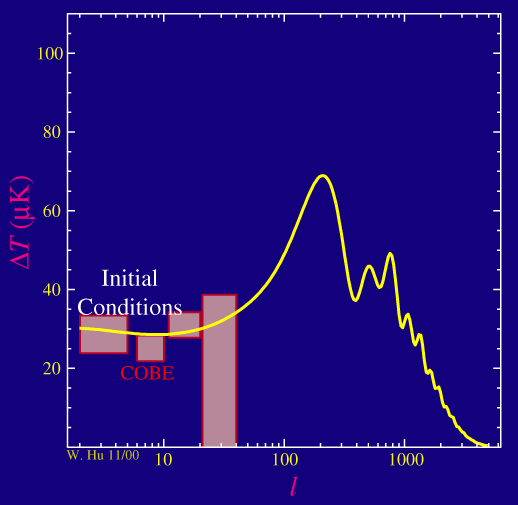
Power Spectrum
Key Concepts:
-
The power
spectrum characterizes the size of the fluctuations
as a function of angular scale
-
COBE meaured only the
largest angular scales in the power spectrum
-
At smaller angular scales, features
are expected in the power spectrum
Ok so if what we are dealing with is actually
noise in the technical sense, what do we do
with it?
When dealing with noise, what we want to do is determine
its spectral properties:
is the noise white, red or blue? Does it have any features?
In this case when we speak of the spectrum of the
noise, we are talking about the angular coherence
of the temperature fluctuations rather than
the temporal coherence of audible noise. Instead of temporal
frequency, we speak of angular frequency called the multipole
moment l. The reciprocal of
lcorresponds to the angular scale which we will call the angular wavelength
of the fluctuation. For example l=10 corresponds to
roughly 10 degrees on the sky, l=100 corresponds to roughly 1 degree
on the sky. Mathematically, the multipole moments arise from
a spherical harmonic decomposition of the fluctuations in angle.
With its resolution of 7 degrees on the sky, the
COBE satellite could only see the largest angle fluctuations:

The units on the y-axis are in micro (millionth of
a) Kelvin. Since the temperature of the CMB is measured to be 2.73K,
this makes the fluctuations 1 part in 100,000 as advertised. Mathematically,
the power spectrum is actually equal to the square of this quantity times
2p/[l(l+1)], where the l's
are there to account for the fact that the sky is two dimensional.
The first thing to note is that the COBE power spectrum
(red boxes, 1 sigma errors and bandwidth of window) is far from white (or
proportional to l in the above plot). There are
correlations in the temperature on the largest angular scales.
These scales are so large that there has not been enough time for the universe
to evolve and so we are seeing mainly the initial
fluctuations, the so-called initial conditions
of the universe.
The second thing to note is that, as depicted in
the yellow theoretical prediction, we expect there to be interesting things
going on at l>100 or on angular scales below a degree. These
structures are called the acoustic peaks.

